Norwegian vs Okinawan Poverty
COMPARE
Norwegian
Okinawan
Poverty
Poverty Comparison
Norwegians
Okinawans
10.5%
POVERTY
99.8/ 100
METRIC RATING
17th/ 347
METRIC RANK
11.6%
POVERTY
92.4/ 100
METRIC RATING
103rd/ 347
METRIC RANK
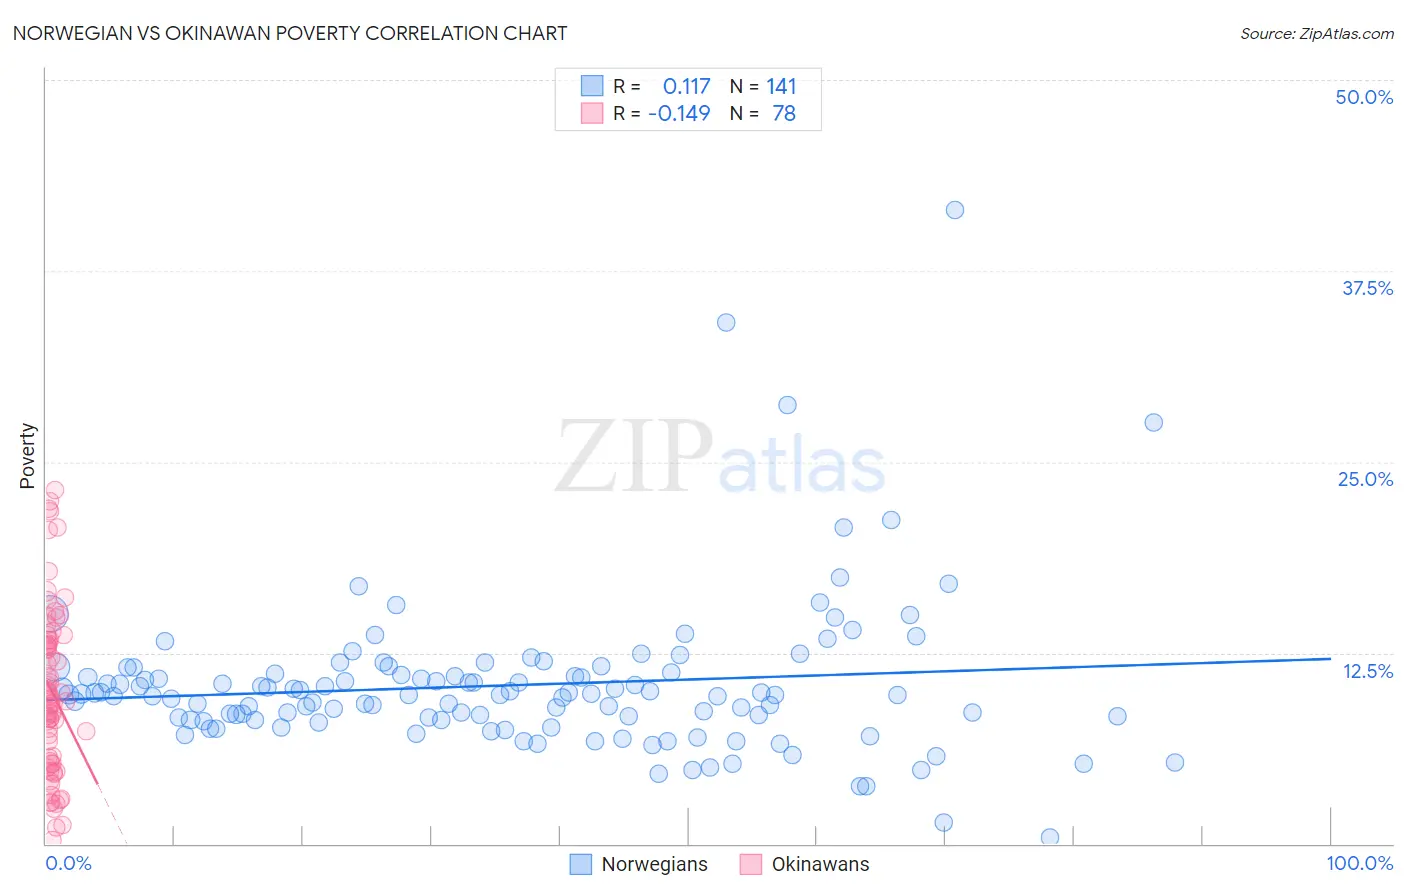
Norwegian vs Okinawan Poverty Correlation Chart
The statistical analysis conducted on geographies consisting of 532,786,336 people shows a poor positive correlation between the proportion of Norwegians and poverty level in the United States with a correlation coefficient (R) of 0.117 and weighted average of 10.5%. Similarly, the statistical analysis conducted on geographies consisting of 73,736,357 people shows a poor negative correlation between the proportion of Okinawans and poverty level in the United States with a correlation coefficient (R) of -0.149 and weighted average of 11.6%, a difference of 10.1%.
Poverty Correlation Summary
| Measurement | Norwegian | Okinawan |
| Minimum | 0.40% | 0.28% |
| Maximum | 41.5% | 23.2% |
| Range | 41.1% | 22.9% |
| Mean | 10.4% | 9.9% |
| Median | 9.8% | 9.4% |
| Interquartile 25% (IQ1) | 8.1% | 5.4% |
| Interquartile 75% (IQ3) | 11.2% | 13.3% |
| Interquartile Range (IQR) | 3.0% | 7.9% |
| Standard Deviation (Sample) | 5.0% | 5.4% |
| Standard Deviation (Population) | 5.0% | 5.4% |
Similar Demographics by Poverty
Demographics Similar to Norwegians by Poverty
In terms of poverty, the demographic groups most similar to Norwegians are Latvian (10.5%, a difference of 0.10%), Lithuanian (10.5%, a difference of 0.37%), Immigrants from Scotland (10.6%, a difference of 0.49%), Immigrants from North Macedonia (10.6%, a difference of 0.60%), and Bolivian (10.4%, a difference of 0.67%).
| Demographics | Rating | Rank | Poverty |
| Bulgarians | 99.9 /100 | #10 | Exceptional 10.2% |
| Immigrants | Lithuania | 99.9 /100 | #11 | Exceptional 10.3% |
| Bhutanese | 99.8 /100 | #12 | Exceptional 10.4% |
| Immigrants | Hong Kong | 99.8 /100 | #13 | Exceptional 10.4% |
| Immigrants | Bolivia | 99.8 /100 | #14 | Exceptional 10.4% |
| Bolivians | 99.8 /100 | #15 | Exceptional 10.4% |
| Lithuanians | 99.8 /100 | #16 | Exceptional 10.5% |
| Norwegians | 99.8 /100 | #17 | Exceptional 10.5% |
| Latvians | 99.8 /100 | #18 | Exceptional 10.5% |
| Immigrants | Scotland | 99.7 /100 | #19 | Exceptional 10.6% |
| Immigrants | North Macedonia | 99.7 /100 | #20 | Exceptional 10.6% |
| Luxembourgers | 99.7 /100 | #21 | Exceptional 10.6% |
| Eastern Europeans | 99.7 /100 | #22 | Exceptional 10.6% |
| Swedes | 99.7 /100 | #23 | Exceptional 10.6% |
| Italians | 99.7 /100 | #24 | Exceptional 10.6% |
Demographics Similar to Okinawans by Poverty
In terms of poverty, the demographic groups most similar to Okinawans are Laotian (11.6%, a difference of 0.010%), Native Hawaiian (11.6%, a difference of 0.11%), Portuguese (11.6%, a difference of 0.13%), Immigrants from Zimbabwe (11.6%, a difference of 0.13%), and Palestinian (11.6%, a difference of 0.22%).
| Demographics | Rating | Rank | Poverty |
| Immigrants | South Africa | 94.7 /100 | #96 | Exceptional 11.5% |
| Immigrants | Egypt | 94.6 /100 | #97 | Exceptional 11.5% |
| Immigrants | Latvia | 94.5 /100 | #98 | Exceptional 11.5% |
| Immigrants | Indonesia | 94.2 /100 | #99 | Exceptional 11.5% |
| Scottish | 94.0 /100 | #100 | Exceptional 11.5% |
| Slavs | 93.3 /100 | #101 | Exceptional 11.5% |
| Laotians | 92.4 /100 | #102 | Exceptional 11.6% |
| Okinawans | 92.4 /100 | #103 | Exceptional 11.6% |
| Native Hawaiians | 92.1 /100 | #104 | Exceptional 11.6% |
| Portuguese | 92.1 /100 | #105 | Exceptional 11.6% |
| Immigrants | Zimbabwe | 92.1 /100 | #106 | Exceptional 11.6% |
| Palestinians | 91.8 /100 | #107 | Exceptional 11.6% |
| Canadians | 91.7 /100 | #108 | Exceptional 11.6% |
| Immigrants | Turkey | 91.7 /100 | #109 | Exceptional 11.6% |
| Welsh | 91.6 /100 | #110 | Exceptional 11.6% |