Norwegian vs Immigrants from Zaire Child Poverty Under the Age of 5
COMPARE
Norwegian
Immigrants from Zaire
Child Poverty Under the Age of 5
Child Poverty Under the Age of 5 Comparison
Norwegians
Immigrants from Zaire
14.6%
CHILD POVERTY UNDER THE AGE OF 5
99.7/ 100
METRIC RATING
39th/ 347
METRIC RANK
21.3%
CHILD POVERTY UNDER THE AGE OF 5
0.0/ 100
METRIC RATING
287th/ 347
METRIC RANK
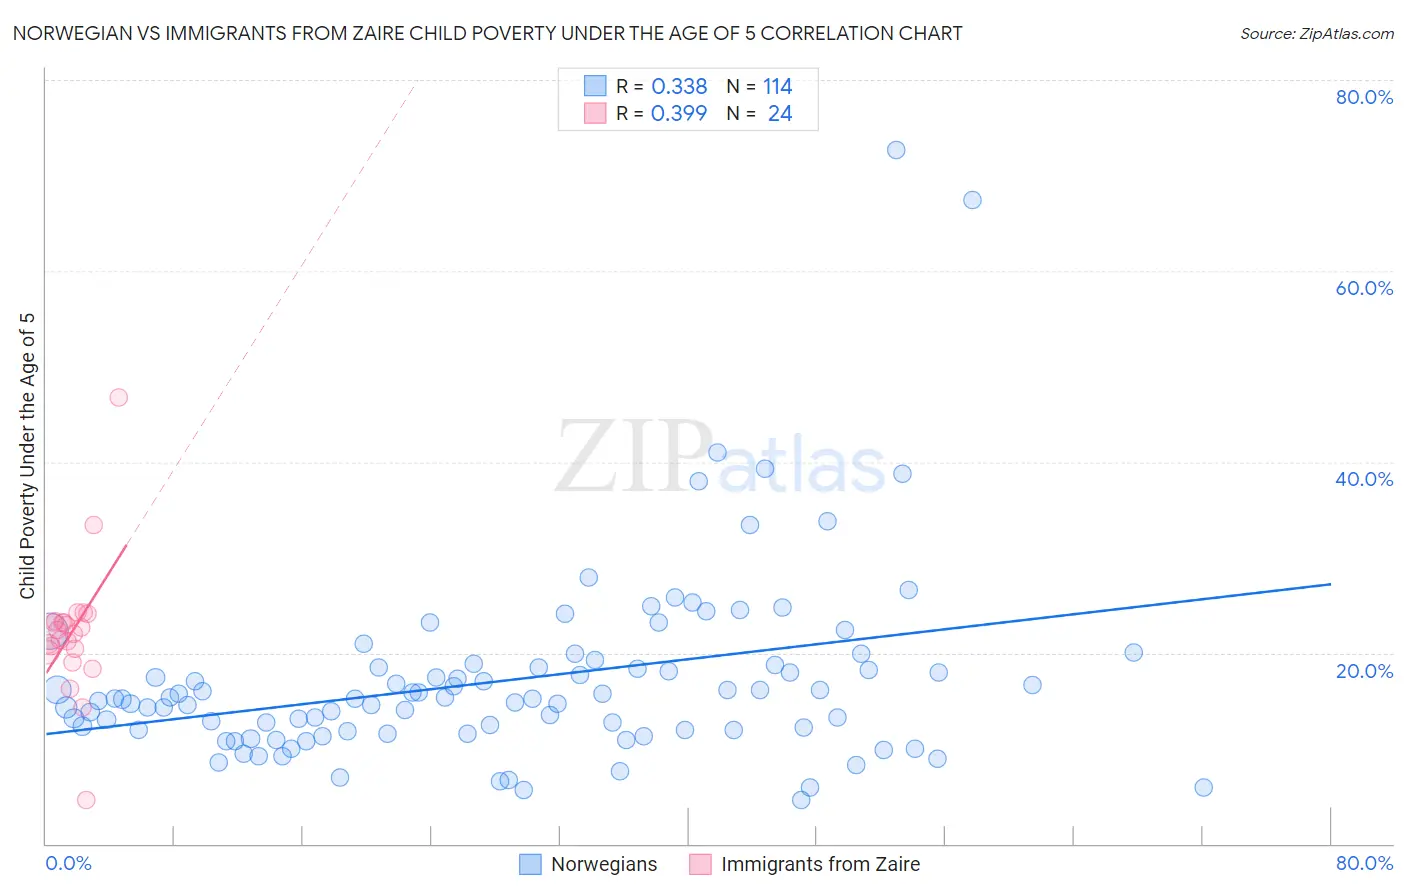
Norwegian vs Immigrants from Zaire Child Poverty Under the Age of 5 Correlation Chart
The statistical analysis conducted on geographies consisting of 498,503,242 people shows a mild positive correlation between the proportion of Norwegians and poverty level among children under the age of 5 in the United States with a correlation coefficient (R) of 0.338 and weighted average of 14.6%. Similarly, the statistical analysis conducted on geographies consisting of 106,157,538 people shows a mild positive correlation between the proportion of Immigrants from Zaire and poverty level among children under the age of 5 in the United States with a correlation coefficient (R) of 0.399 and weighted average of 21.3%, a difference of 45.5%.
Child Poverty Under the Age of 5 Correlation Summary
| Measurement | Norwegian | Immigrants from Zaire |
| Minimum | 4.5% | 4.6% |
| Maximum | 72.7% | 46.8% |
| Range | 68.2% | 42.2% |
| Mean | 17.2% | 22.2% |
| Median | 15.2% | 22.2% |
| Interquartile 25% (IQ1) | 11.9% | 20.3% |
| Interquartile 75% (IQ3) | 18.5% | 23.3% |
| Interquartile Range (IQR) | 6.6% | 3.0% |
| Standard Deviation (Sample) | 10.0% | 7.2% |
| Standard Deviation (Population) | 10.0% | 7.0% |
Similar Demographics by Child Poverty Under the Age of 5
Demographics Similar to Norwegians by Child Poverty Under the Age of 5
In terms of child poverty under the age of 5, the demographic groups most similar to Norwegians are Eastern European (14.6%, a difference of 0.0%), Turkish (14.6%, a difference of 0.27%), Immigrants from Australia (14.6%, a difference of 0.29%), Immigrants from Belarus (14.7%, a difference of 0.41%), and Soviet Union (14.7%, a difference of 0.57%).
| Demographics | Rating | Rank | Child Poverty Under the Age of 5 |
| Immigrants | Sri Lanka | 99.8 /100 | #32 | Exceptional 14.4% |
| Taiwanese | 99.8 /100 | #33 | Exceptional 14.5% |
| Immigrants | Moldova | 99.8 /100 | #34 | Exceptional 14.5% |
| Latvians | 99.8 /100 | #35 | Exceptional 14.5% |
| Maltese | 99.8 /100 | #36 | Exceptional 14.5% |
| Turks | 99.7 /100 | #37 | Exceptional 14.6% |
| Eastern Europeans | 99.7 /100 | #38 | Exceptional 14.6% |
| Norwegians | 99.7 /100 | #39 | Exceptional 14.6% |
| Immigrants | Australia | 99.7 /100 | #40 | Exceptional 14.6% |
| Immigrants | Belarus | 99.7 /100 | #41 | Exceptional 14.7% |
| Soviet Union | 99.7 /100 | #42 | Exceptional 14.7% |
| Immigrants | Greece | 99.7 /100 | #43 | Exceptional 14.7% |
| Immigrants | Philippines | 99.7 /100 | #44 | Exceptional 14.7% |
| Laotians | 99.6 /100 | #45 | Exceptional 14.7% |
| Tsimshian | 99.6 /100 | #46 | Exceptional 14.7% |
Demographics Similar to Immigrants from Zaire by Child Poverty Under the Age of 5
In terms of child poverty under the age of 5, the demographic groups most similar to Immigrants from Zaire are Immigrants from Latin America (21.2%, a difference of 0.090%), Haitian (21.2%, a difference of 0.17%), Immigrants from Senegal (21.3%, a difference of 0.17%), Immigrants from Haiti (21.3%, a difference of 0.25%), and Somali (21.1%, a difference of 0.64%).
| Demographics | Rating | Rank | Child Poverty Under the Age of 5 |
| French American Indians | 0.0 /100 | #280 | Tragic 20.8% |
| Senegalese | 0.0 /100 | #281 | Tragic 20.9% |
| Potawatomi | 0.0 /100 | #282 | Tragic 21.0% |
| Comanche | 0.0 /100 | #283 | Tragic 21.0% |
| Somalis | 0.0 /100 | #284 | Tragic 21.1% |
| Haitians | 0.0 /100 | #285 | Tragic 21.2% |
| Immigrants | Latin America | 0.0 /100 | #286 | Tragic 21.2% |
| Immigrants | Zaire | 0.0 /100 | #287 | Tragic 21.3% |
| Immigrants | Senegal | 0.0 /100 | #288 | Tragic 21.3% |
| Immigrants | Haiti | 0.0 /100 | #289 | Tragic 21.3% |
| Immigrants | Caribbean | 0.0 /100 | #290 | Tragic 21.4% |
| British West Indians | 0.0 /100 | #291 | Tragic 21.4% |
| Immigrants | Somalia | 0.0 /100 | #292 | Tragic 21.6% |
| Mexicans | 0.0 /100 | #293 | Tragic 21.6% |
| Guatemalans | 0.0 /100 | #294 | Tragic 21.6% |