Norwegian vs Immigrants from Cuba Child Poverty Among Boys Under 16
COMPARE
Norwegian
Immigrants from Cuba
Child Poverty Among Boys Under 16
Child Poverty Among Boys Under 16 Comparison
Norwegians
Immigrants from Cuba
13.2%
CHILD POVERTY AMONG BOYS UNDER 16
99.9/ 100
METRIC RATING
17th/ 347
METRIC RANK
18.8%
CHILD POVERTY AMONG BOYS UNDER 16
0.6/ 100
METRIC RATING
240th/ 347
METRIC RANK
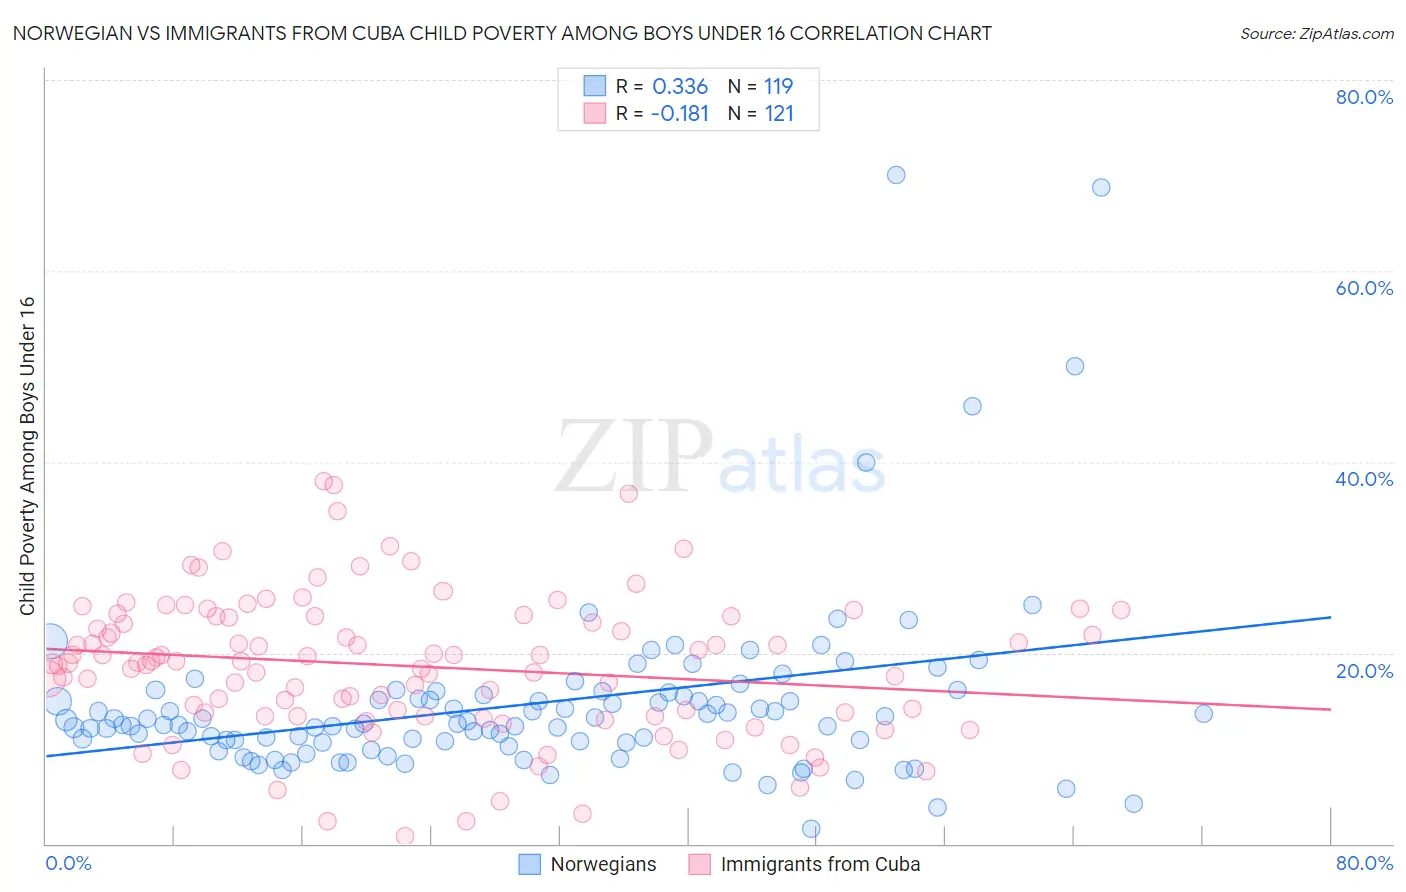
Norwegian vs Immigrants from Cuba Child Poverty Among Boys Under 16 Correlation Chart
The statistical analysis conducted on geographies consisting of 516,210,620 people shows a mild positive correlation between the proportion of Norwegians and poverty level among boys under the age of 16 in the United States with a correlation coefficient (R) of 0.336 and weighted average of 13.2%. Similarly, the statistical analysis conducted on geographies consisting of 321,856,633 people shows a poor negative correlation between the proportion of Immigrants from Cuba and poverty level among boys under the age of 16 in the United States with a correlation coefficient (R) of -0.181 and weighted average of 18.8%, a difference of 42.4%.
Child Poverty Among Boys Under 16 Correlation Summary
| Measurement | Norwegian | Immigrants from Cuba |
| Minimum | 1.6% | 0.84% |
| Maximum | 70.0% | 37.9% |
| Range | 68.4% | 37.1% |
| Mean | 14.7% | 18.6% |
| Median | 12.6% | 19.0% |
| Interquartile 25% (IQ1) | 10.6% | 13.4% |
| Interquartile 75% (IQ3) | 15.6% | 23.8% |
| Interquartile Range (IQR) | 4.9% | 10.4% |
| Standard Deviation (Sample) | 9.8% | 7.4% |
| Standard Deviation (Population) | 9.7% | 7.4% |
Similar Demographics by Child Poverty Among Boys Under 16
Demographics Similar to Norwegians by Child Poverty Among Boys Under 16
In terms of child poverty among boys under 16, the demographic groups most similar to Norwegians are Maltese (13.2%, a difference of 0.090%), Immigrants from Japan (13.1%, a difference of 0.41%), Immigrants from Ireland (13.1%, a difference of 0.51%), Bulgarian (13.3%, a difference of 0.53%), and Bolivian (13.3%, a difference of 0.59%).
| Demographics | Rating | Rank | Child Poverty Among Boys Under 16 |
| Bhutanese | 100.0 /100 | #10 | Exceptional 12.6% |
| Immigrants | South Central Asia | 100.0 /100 | #11 | Exceptional 12.7% |
| Burmese | 99.9 /100 | #12 | Exceptional 13.0% |
| Immigrants | Korea | 99.9 /100 | #13 | Exceptional 13.0% |
| Immigrants | Ireland | 99.9 /100 | #14 | Exceptional 13.1% |
| Immigrants | Japan | 99.9 /100 | #15 | Exceptional 13.1% |
| Maltese | 99.9 /100 | #16 | Exceptional 13.2% |
| Norwegians | 99.9 /100 | #17 | Exceptional 13.2% |
| Bulgarians | 99.9 /100 | #18 | Exceptional 13.3% |
| Bolivians | 99.9 /100 | #19 | Exceptional 13.3% |
| Indians (Asian) | 99.9 /100 | #20 | Exceptional 13.3% |
| Immigrants | Eastern Asia | 99.9 /100 | #21 | Exceptional 13.3% |
| Tongans | 99.9 /100 | #22 | Exceptional 13.4% |
| Latvians | 99.9 /100 | #23 | Exceptional 13.4% |
| Immigrants | Lithuania | 99.8 /100 | #24 | Exceptional 13.5% |
Demographics Similar to Immigrants from Cuba by Child Poverty Among Boys Under 16
In terms of child poverty among boys under 16, the demographic groups most similar to Immigrants from Cuba are Immigrants from Sudan (18.8%, a difference of 0.050%), Cape Verdean (18.7%, a difference of 0.34%), Ghanaian (18.9%, a difference of 0.56%), Immigrants from Laos (18.7%, a difference of 0.57%), and Immigrants from Eritrea (18.6%, a difference of 0.79%).
| Demographics | Rating | Rank | Child Poverty Among Boys Under 16 |
| Immigrants | Nigeria | 1.2 /100 | #233 | Tragic 18.4% |
| Nigerians | 1.1 /100 | #234 | Tragic 18.5% |
| Americans | 0.9 /100 | #235 | Tragic 18.6% |
| Sudanese | 0.9 /100 | #236 | Tragic 18.6% |
| Immigrants | Eritrea | 0.8 /100 | #237 | Tragic 18.6% |
| Immigrants | Laos | 0.8 /100 | #238 | Tragic 18.7% |
| Cape Verdeans | 0.7 /100 | #239 | Tragic 18.7% |
| Immigrants | Cuba | 0.6 /100 | #240 | Tragic 18.8% |
| Immigrants | Sudan | 0.6 /100 | #241 | Tragic 18.8% |
| Ghanaians | 0.5 /100 | #242 | Tragic 18.9% |
| Immigrants | Azores | 0.4 /100 | #243 | Tragic 18.9% |
| Immigrants | Middle Africa | 0.4 /100 | #244 | Tragic 18.9% |
| Cree | 0.4 /100 | #245 | Tragic 19.0% |
| Immigrants | Nicaragua | 0.4 /100 | #246 | Tragic 19.0% |
| Immigrants | Trinidad and Tobago | 0.3 /100 | #247 | Tragic 19.0% |