Northern European vs Shoshone Seniors Poverty Over the Age of 75
COMPARE
Northern European
Shoshone
Seniors Poverty Over the Age of 75
Seniors Poverty Over the Age of 75 Comparison
Northern Europeans
Shoshone
10.7%
SENIORS POVERTY OVER THE AGE OF 75
99.8/ 100
METRIC RATING
27th/ 347
METRIC RANK
13.1%
SENIORS POVERTY OVER THE AGE OF 75
2.6/ 100
METRIC RATING
226th/ 347
METRIC RANK
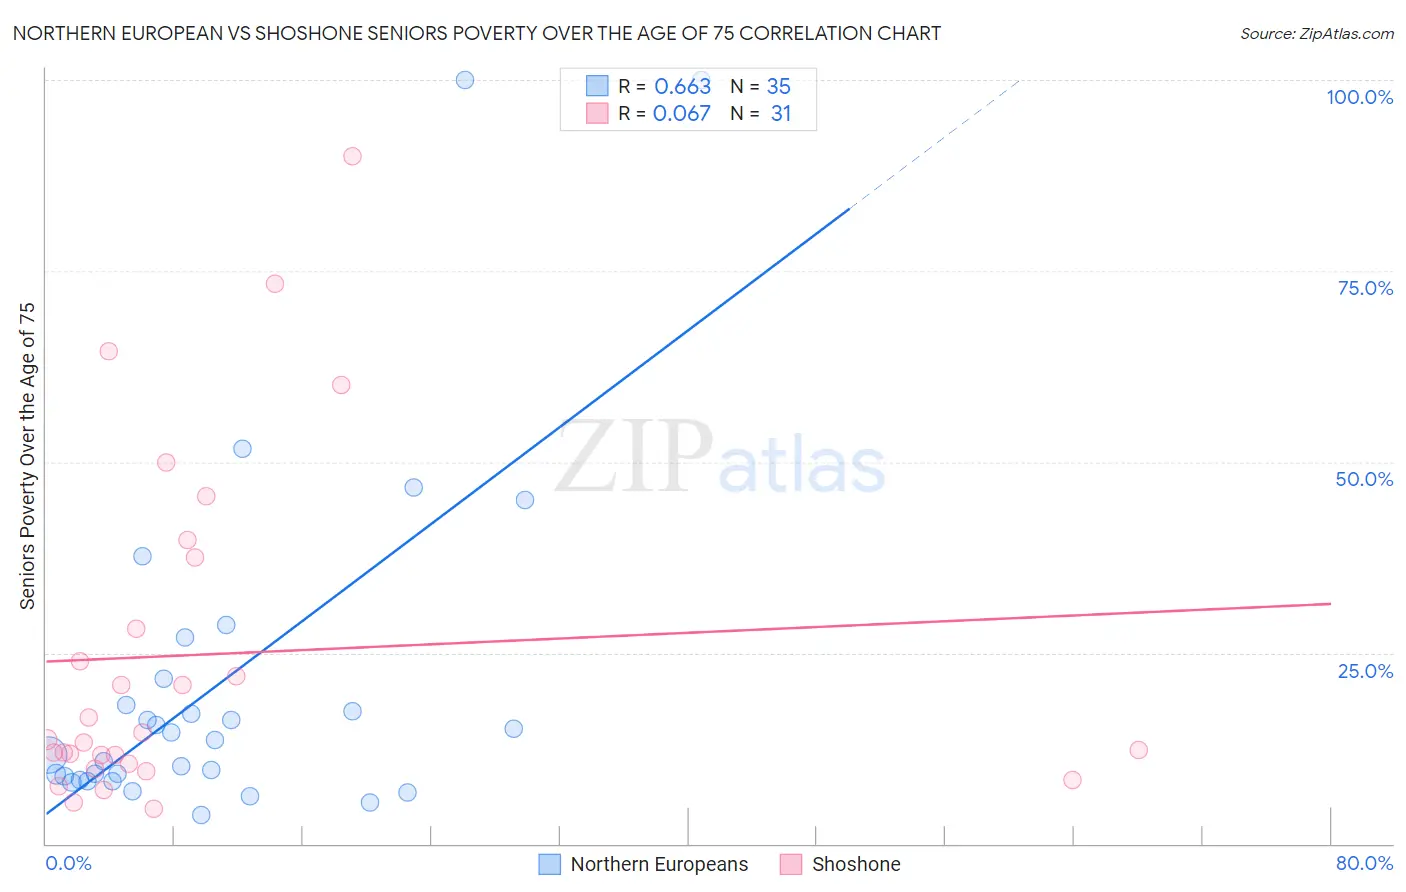
Northern European vs Shoshone Seniors Poverty Over the Age of 75 Correlation Chart
The statistical analysis conducted on geographies consisting of 400,431,861 people shows a significant positive correlation between the proportion of Northern Europeans and poverty level among seniors over the age of 75 in the United States with a correlation coefficient (R) of 0.663 and weighted average of 10.7%. Similarly, the statistical analysis conducted on geographies consisting of 66,327,855 people shows a slight positive correlation between the proportion of Shoshone and poverty level among seniors over the age of 75 in the United States with a correlation coefficient (R) of 0.067 and weighted average of 13.1%, a difference of 22.5%.
Seniors Poverty Over the Age of 75 Correlation Summary
| Measurement | Northern European | Shoshone |
| Minimum | 3.8% | 4.6% |
| Maximum | 100.0% | 90.0% |
| Range | 96.2% | 85.4% |
| Mean | 21.2% | 24.8% |
| Median | 13.5% | 13.7% |
| Interquartile 25% (IQ1) | 8.3% | 10.6% |
| Interquartile 75% (IQ3) | 21.6% | 37.5% |
| Interquartile Range (IQR) | 13.4% | 26.9% |
| Standard Deviation (Sample) | 23.1% | 22.1% |
| Standard Deviation (Population) | 22.7% | 21.8% |
Similar Demographics by Seniors Poverty Over the Age of 75
Demographics Similar to Northern Europeans by Seniors Poverty Over the Age of 75
In terms of seniors poverty over the age of 75, the demographic groups most similar to Northern Europeans are Irish (10.7%, a difference of 0.060%), Assyrian/Chaldean/Syriac (10.7%, a difference of 0.21%), Bulgarian (10.7%, a difference of 0.27%), Swiss (10.7%, a difference of 0.29%), and Marshallese (10.7%, a difference of 0.48%).
| Demographics | Rating | Rank | Seniors Poverty Over the Age of 75 |
| Czechs | 99.9 /100 | #20 | Exceptional 10.5% |
| Slovenes | 99.9 /100 | #21 | Exceptional 10.6% |
| Bhutanese | 99.8 /100 | #22 | Exceptional 10.6% |
| Lithuanians | 99.8 /100 | #23 | Exceptional 10.6% |
| Poles | 99.8 /100 | #24 | Exceptional 10.6% |
| Menominee | 99.8 /100 | #25 | Exceptional 10.6% |
| Bulgarians | 99.8 /100 | #26 | Exceptional 10.7% |
| Northern Europeans | 99.8 /100 | #27 | Exceptional 10.7% |
| Irish | 99.8 /100 | #28 | Exceptional 10.7% |
| Assyrians/Chaldeans/Syriacs | 99.8 /100 | #29 | Exceptional 10.7% |
| Swiss | 99.7 /100 | #30 | Exceptional 10.7% |
| Marshallese | 99.7 /100 | #31 | Exceptional 10.7% |
| British | 99.7 /100 | #32 | Exceptional 10.7% |
| Puget Sound Salish | 99.7 /100 | #33 | Exceptional 10.8% |
| Italians | 99.7 /100 | #34 | Exceptional 10.8% |
Demographics Similar to Shoshone by Seniors Poverty Over the Age of 75
In terms of seniors poverty over the age of 75, the demographic groups most similar to Shoshone are Immigrants from Morocco (13.1%, a difference of 0.16%), Chippewa (13.1%, a difference of 0.23%), Cree (13.1%, a difference of 0.26%), Immigrants from Nigeria (13.0%, a difference of 0.43%), and Nigerian (13.0%, a difference of 0.52%).
| Demographics | Rating | Rank | Seniors Poverty Over the Age of 75 |
| Ute | 4.7 /100 | #219 | Tragic 12.9% |
| Seminole | 4.5 /100 | #220 | Tragic 12.9% |
| Immigrants | Kazakhstan | 4.3 /100 | #221 | Tragic 13.0% |
| Nigerians | 3.4 /100 | #222 | Tragic 13.0% |
| Immigrants | Nigeria | 3.3 /100 | #223 | Tragic 13.0% |
| Chippewa | 2.9 /100 | #224 | Tragic 13.1% |
| Immigrants | Morocco | 2.8 /100 | #225 | Tragic 13.1% |
| Shoshone | 2.6 /100 | #226 | Tragic 13.1% |
| Cree | 2.3 /100 | #227 | Tragic 13.1% |
| Israelis | 2.0 /100 | #228 | Tragic 13.2% |
| Somalis | 1.6 /100 | #229 | Tragic 13.2% |
| Immigrants | China | 1.5 /100 | #230 | Tragic 13.2% |
| Sub-Saharan Africans | 1.5 /100 | #231 | Tragic 13.2% |
| Immigrants | Chile | 1.3 /100 | #232 | Tragic 13.3% |
| Immigrants | Costa Rica | 1.3 /100 | #233 | Tragic 13.3% |