Northern European vs Immigrants from Dominica Female Poverty Among 25-34 Year Olds
COMPARE
Northern European
Immigrants from Dominica
Female Poverty Among 25-34 Year Olds
Female Poverty Among 25-34 Year Olds Comparison
Northern Europeans
Immigrants from Dominica
13.2%
FEMALE POVERTY AMONG 25-34 YEAR OLDS
73.7/ 100
METRIC RATING
153rd/ 347
METRIC RANK
16.5%
FEMALE POVERTY AMONG 25-34 YEAR OLDS
0.0/ 100
METRIC RATING
292nd/ 347
METRIC RANK
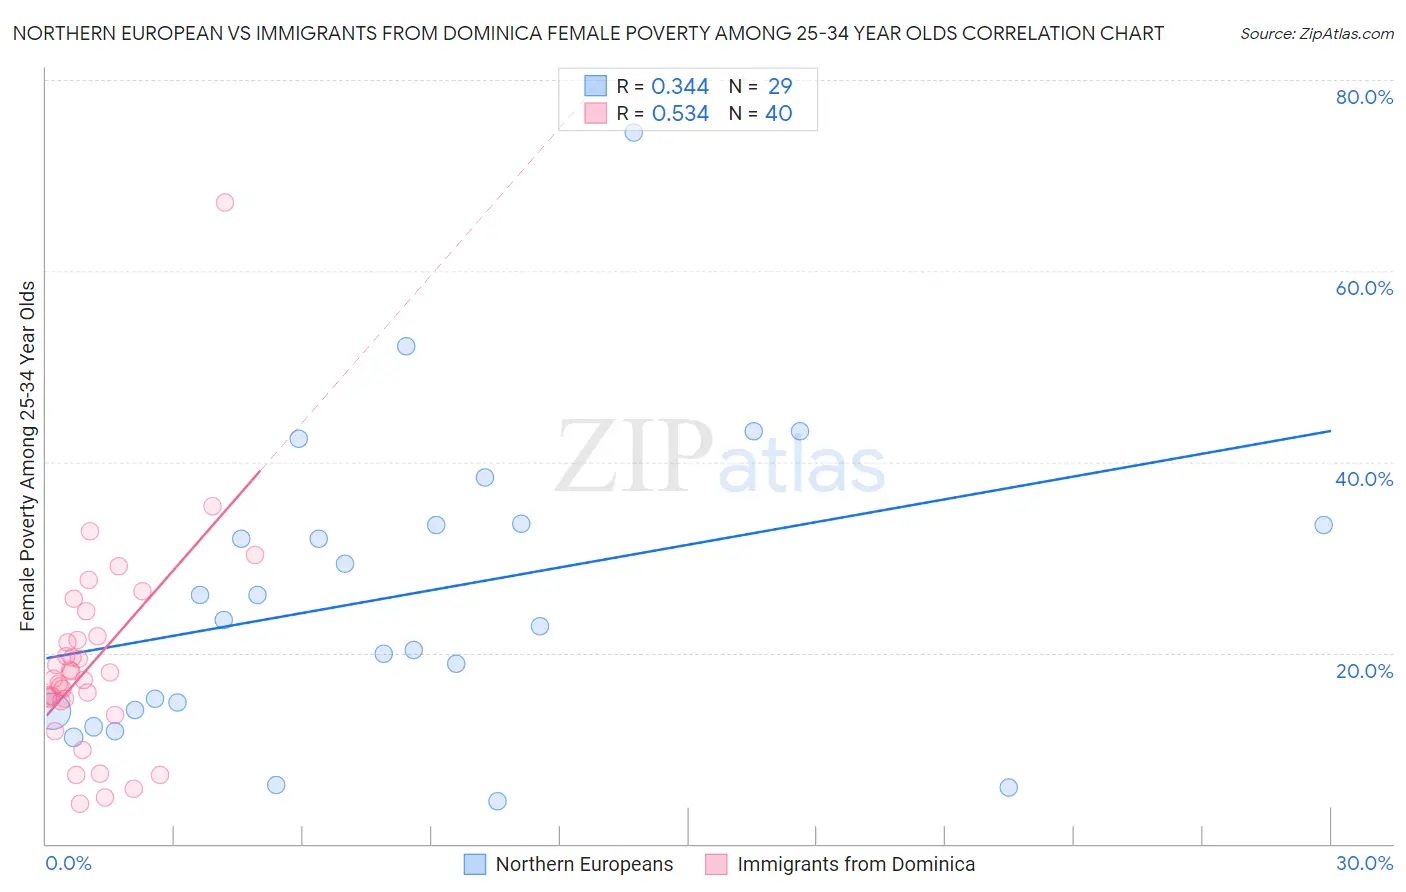
Northern European vs Immigrants from Dominica Female Poverty Among 25-34 Year Olds Correlation Chart
The statistical analysis conducted on geographies consisting of 397,775,454 people shows a mild positive correlation between the proportion of Northern Europeans and poverty level among females between the ages 25 and 34 in the United States with a correlation coefficient (R) of 0.344 and weighted average of 13.2%. Similarly, the statistical analysis conducted on geographies consisting of 83,518,796 people shows a substantial positive correlation between the proportion of Immigrants from Dominica and poverty level among females between the ages 25 and 34 in the United States with a correlation coefficient (R) of 0.534 and weighted average of 16.5%, a difference of 24.3%.
Female Poverty Among 25-34 Year Olds Correlation Summary
| Measurement | Northern European | Immigrants from Dominica |
| Minimum | 4.5% | 4.2% |
| Maximum | 74.5% | 67.1% |
| Range | 70.1% | 63.0% |
| Mean | 26.0% | 18.9% |
| Median | 23.5% | 17.2% |
| Interquartile 25% (IQ1) | 13.9% | 15.0% |
| Interquartile 75% (IQ3) | 33.4% | 21.5% |
| Interquartile Range (IQR) | 19.5% | 6.4% |
| Standard Deviation (Sample) | 15.6% | 10.8% |
| Standard Deviation (Population) | 15.4% | 10.6% |
Similar Demographics by Female Poverty Among 25-34 Year Olds
Demographics Similar to Northern Europeans by Female Poverty Among 25-34 Year Olds
In terms of female poverty among 25-34 year olds, the demographic groups most similar to Northern Europeans are Arab (13.2%, a difference of 0.020%), Immigrants from Sierra Leone (13.3%, a difference of 0.090%), Immigrants from Cameroon (13.3%, a difference of 0.18%), Slavic (13.2%, a difference of 0.23%), and Costa Rican (13.2%, a difference of 0.24%).
| Demographics | Rating | Rank | Female Poverty Among 25-34 Year Olds |
| South Americans | 76.9 /100 | #146 | Good 13.2% |
| Europeans | 76.8 /100 | #147 | Good 13.2% |
| Lebanese | 76.8 /100 | #148 | Good 13.2% |
| Sierra Leoneans | 76.3 /100 | #149 | Good 13.2% |
| Iraqis | 76.0 /100 | #150 | Good 13.2% |
| Costa Ricans | 75.8 /100 | #151 | Good 13.2% |
| Slavs | 75.7 /100 | #152 | Good 13.2% |
| Northern Europeans | 73.7 /100 | #153 | Good 13.2% |
| Arabs | 73.5 /100 | #154 | Good 13.2% |
| Immigrants | Sierra Leone | 72.9 /100 | #155 | Good 13.3% |
| Immigrants | Cameroon | 72.0 /100 | #156 | Good 13.3% |
| Immigrants | Western Europe | 70.3 /100 | #157 | Good 13.3% |
| Immigrants | Colombia | 69.2 /100 | #158 | Good 13.3% |
| Uruguayans | 66.9 /100 | #159 | Good 13.3% |
| Immigrants | South America | 66.3 /100 | #160 | Good 13.3% |
Demographics Similar to Immigrants from Dominica by Female Poverty Among 25-34 Year Olds
In terms of female poverty among 25-34 year olds, the demographic groups most similar to Immigrants from Dominica are Comanche (16.5%, a difference of 0.010%), Potawatomi (16.5%, a difference of 0.27%), Indonesian (16.4%, a difference of 0.30%), Osage (16.4%, a difference of 0.45%), and Guatemalan (16.4%, a difference of 0.52%).
| Demographics | Rating | Rank | Female Poverty Among 25-34 Year Olds |
| Immigrants | Bahamas | 0.0 /100 | #285 | Tragic 16.3% |
| Cape Verdeans | 0.0 /100 | #286 | Tragic 16.3% |
| Americans | 0.0 /100 | #287 | Tragic 16.4% |
| Guatemalans | 0.0 /100 | #288 | Tragic 16.4% |
| Osage | 0.0 /100 | #289 | Tragic 16.4% |
| Indonesians | 0.0 /100 | #290 | Tragic 16.4% |
| Comanche | 0.0 /100 | #291 | Tragic 16.5% |
| Immigrants | Dominica | 0.0 /100 | #292 | Tragic 16.5% |
| Potawatomi | 0.0 /100 | #293 | Tragic 16.5% |
| Immigrants | Central America | 0.0 /100 | #294 | Tragic 16.6% |
| Mexicans | 0.0 /100 | #295 | Tragic 16.6% |
| Hispanics or Latinos | 0.0 /100 | #296 | Tragic 16.6% |
| Immigrants | Guatemala | 0.0 /100 | #297 | Tragic 16.6% |
| Blackfeet | 0.0 /100 | #298 | Tragic 16.7% |
| Spanish Americans | 0.0 /100 | #299 | Tragic 16.7% |