Northern European vs Celtic Seniors Poverty Over the Age of 65
COMPARE
Northern European
Celtic
Seniors Poverty Over the Age of 65
Seniors Poverty Over the Age of 65 Comparison
Northern Europeans
Celtics
9.4%
SENIORS POVERTY OVER THE AGE OF 65
99.8/ 100
METRIC RATING
32nd/ 347
METRIC RANK
9.8%
SENIORS POVERTY OVER THE AGE OF 65
99.0/ 100
METRIC RATING
60th/ 347
METRIC RANK
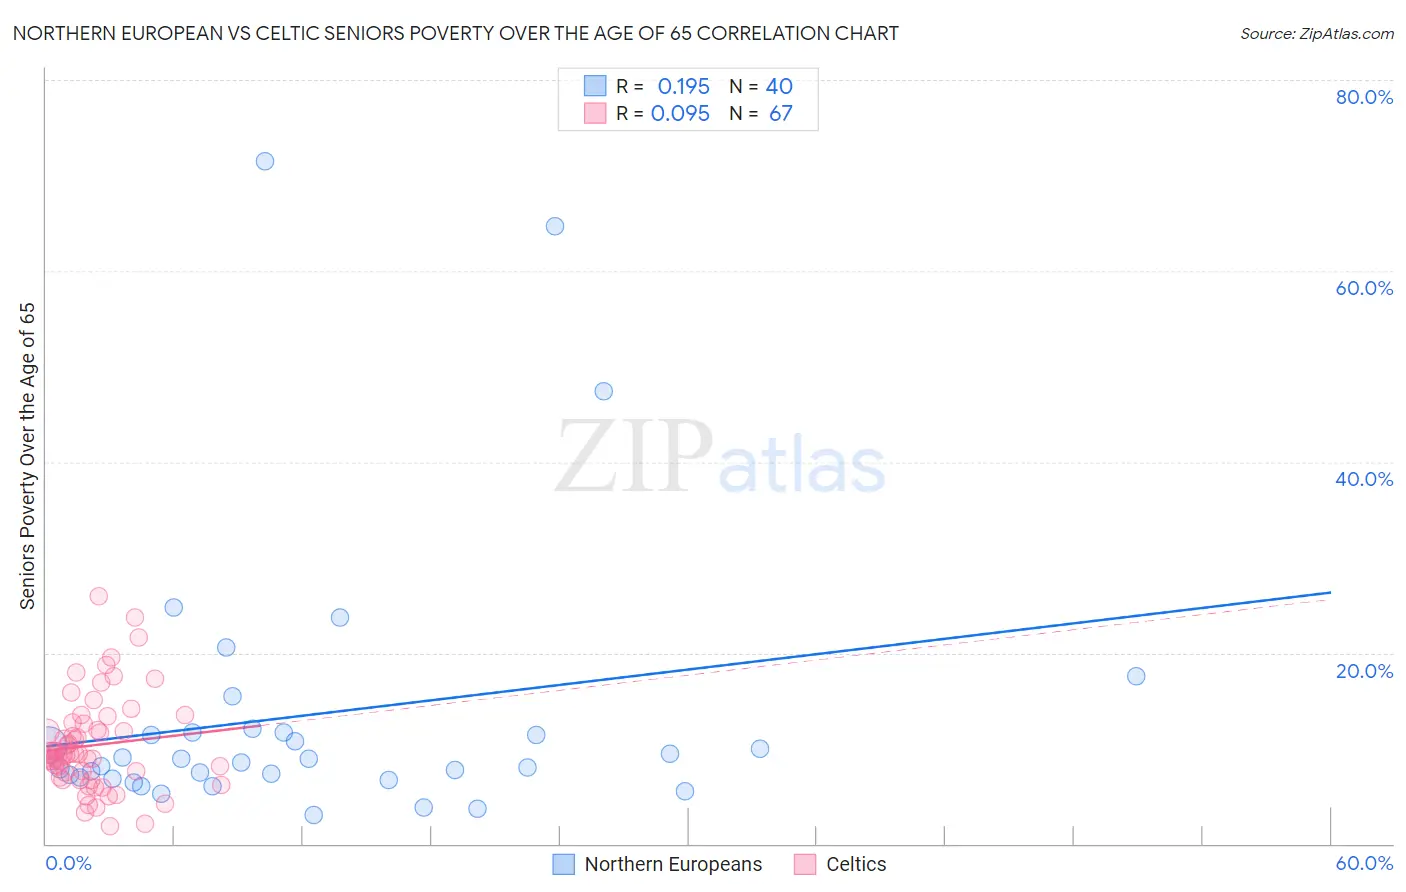
Northern European vs Celtic Seniors Poverty Over the Age of 65 Correlation Chart
The statistical analysis conducted on geographies consisting of 404,631,696 people shows a poor positive correlation between the proportion of Northern Europeans and poverty level among seniors over the age of 65 in the United States with a correlation coefficient (R) of 0.195 and weighted average of 9.4%. Similarly, the statistical analysis conducted on geographies consisting of 168,620,059 people shows a slight positive correlation between the proportion of Celtics and poverty level among seniors over the age of 65 in the United States with a correlation coefficient (R) of 0.095 and weighted average of 9.8%, a difference of 4.4%.
Seniors Poverty Over the Age of 65 Correlation Summary
| Measurement | Northern European | Celtic |
| Minimum | 3.0% | 1.8% |
| Maximum | 71.5% | 26.0% |
| Range | 68.5% | 24.1% |
| Mean | 13.5% | 10.3% |
| Median | 8.7% | 9.4% |
| Interquartile 25% (IQ1) | 6.9% | 6.9% |
| Interquartile 75% (IQ3) | 11.6% | 12.5% |
| Interquartile Range (IQR) | 4.7% | 5.6% |
| Standard Deviation (Sample) | 14.8% | 4.9% |
| Standard Deviation (Population) | 14.6% | 4.9% |
Similar Demographics by Seniors Poverty Over the Age of 65
Demographics Similar to Northern Europeans by Seniors Poverty Over the Age of 65
In terms of seniors poverty over the age of 65, the demographic groups most similar to Northern Europeans are Native Hawaiian (9.4%, a difference of 0.020%), British (9.4%, a difference of 0.12%), Finnish (9.4%, a difference of 0.28%), Menominee (9.4%, a difference of 0.50%), and Latvian (9.5%, a difference of 0.50%).
| Demographics | Rating | Rank | Seniors Poverty Over the Age of 65 |
| Irish | 99.9 /100 | #25 | Exceptional 9.3% |
| Immigrants | Scotland | 99.9 /100 | #26 | Exceptional 9.3% |
| Italians | 99.9 /100 | #27 | Exceptional 9.3% |
| Tongans | 99.9 /100 | #28 | Exceptional 9.3% |
| Bhutanese | 99.9 /100 | #29 | Exceptional 9.3% |
| Menominee | 99.8 /100 | #30 | Exceptional 9.4% |
| Finns | 99.8 /100 | #31 | Exceptional 9.4% |
| Northern Europeans | 99.8 /100 | #32 | Exceptional 9.4% |
| Native Hawaiians | 99.8 /100 | #33 | Exceptional 9.4% |
| British | 99.8 /100 | #34 | Exceptional 9.4% |
| Latvians | 99.8 /100 | #35 | Exceptional 9.5% |
| Czechoslovakians | 99.8 /100 | #36 | Exceptional 9.5% |
| Scotch-Irish | 99.7 /100 | #37 | Exceptional 9.5% |
| Belgians | 99.7 /100 | #38 | Exceptional 9.5% |
| Greeks | 99.6 /100 | #39 | Exceptional 9.6% |
Demographics Similar to Celtics by Seniors Poverty Over the Age of 65
In terms of seniors poverty over the age of 65, the demographic groups most similar to Celtics are Immigrants from Canada (9.8%, a difference of 0.030%), Iranian (9.8%, a difference of 0.080%), French Canadian (9.8%, a difference of 0.13%), Serbian (9.8%, a difference of 0.18%), and Bolivian (9.8%, a difference of 0.25%).
| Demographics | Rating | Rank | Seniors Poverty Over the Age of 65 |
| Slavs | 99.2 /100 | #53 | Exceptional 9.8% |
| Immigrants | Northern Europe | 99.2 /100 | #54 | Exceptional 9.8% |
| Afghans | 99.2 /100 | #55 | Exceptional 9.8% |
| Immigrants | England | 99.1 /100 | #56 | Exceptional 9.8% |
| Bolivians | 99.1 /100 | #57 | Exceptional 9.8% |
| Serbians | 99.1 /100 | #58 | Exceptional 9.8% |
| Immigrants | Canada | 99.0 /100 | #59 | Exceptional 9.8% |
| Celtics | 99.0 /100 | #60 | Exceptional 9.8% |
| Iranians | 98.9 /100 | #61 | Exceptional 9.8% |
| French Canadians | 98.9 /100 | #62 | Exceptional 9.8% |
| Macedonians | 98.8 /100 | #63 | Exceptional 9.9% |
| Immigrants | North America | 98.8 /100 | #64 | Exceptional 9.9% |
| Pennsylvania Germans | 98.7 /100 | #65 | Exceptional 9.9% |
| Immigrants | Netherlands | 98.7 /100 | #66 | Exceptional 9.9% |
| Immigrants | Austria | 98.6 /100 | #67 | Exceptional 9.9% |