Northern European vs Assyrian/Chaldean/Syriac Child Poverty Among Boys Under 16
COMPARE
Northern European
Assyrian/Chaldean/Syriac
Child Poverty Among Boys Under 16
Child Poverty Among Boys Under 16 Comparison
Northern Europeans
Assyrians/Chaldeans/Syriacs
14.8%
CHILD POVERTY AMONG BOYS UNDER 16
97.2/ 100
METRIC RATING
87th/ 347
METRIC RANK
13.6%
CHILD POVERTY AMONG BOYS UNDER 16
99.8/ 100
METRIC RATING
34th/ 347
METRIC RANK
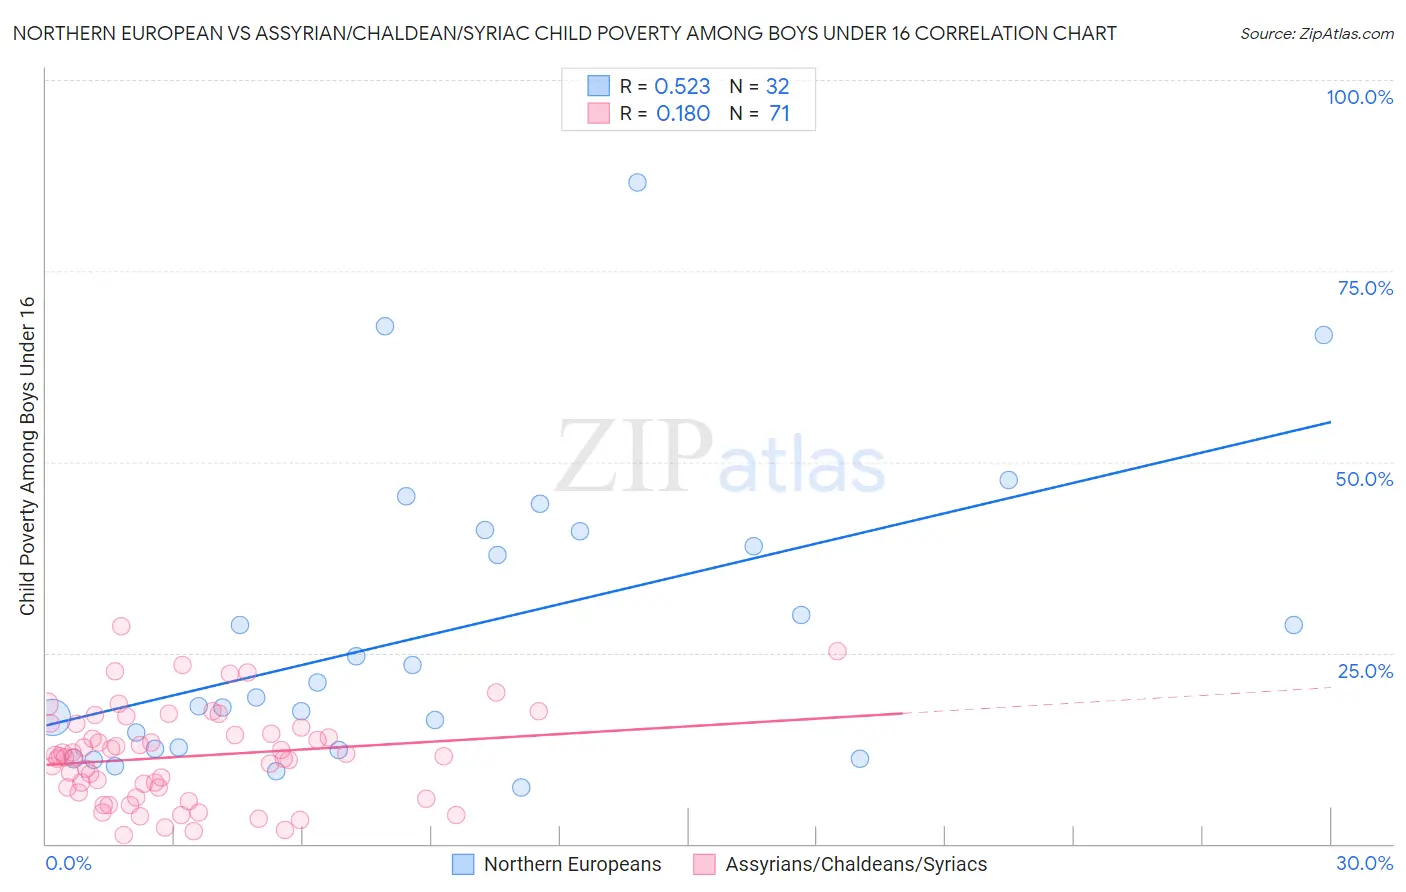
Northern European vs Assyrian/Chaldean/Syriac Child Poverty Among Boys Under 16 Correlation Chart
The statistical analysis conducted on geographies consisting of 397,912,206 people shows a substantial positive correlation between the proportion of Northern Europeans and poverty level among boys under the age of 16 in the United States with a correlation coefficient (R) of 0.523 and weighted average of 14.8%. Similarly, the statistical analysis conducted on geographies consisting of 109,529,261 people shows a poor positive correlation between the proportion of Assyrians/Chaldeans/Syriacs and poverty level among boys under the age of 16 in the United States with a correlation coefficient (R) of 0.180 and weighted average of 13.6%, a difference of 8.7%.
Child Poverty Among Boys Under 16 Correlation Summary
| Measurement | Northern European | Assyrian/Chaldean/Syriac |
| Minimum | 7.4% | 1.2% |
| Maximum | 86.6% | 28.5% |
| Range | 79.3% | 27.3% |
| Mean | 27.8% | 11.4% |
| Median | 20.1% | 11.5% |
| Interquartile 25% (IQ1) | 12.5% | 6.7% |
| Interquartile 75% (IQ3) | 39.9% | 15.2% |
| Interquartile Range (IQR) | 27.4% | 8.4% |
| Standard Deviation (Sample) | 19.4% | 6.1% |
| Standard Deviation (Population) | 19.1% | 6.0% |
Similar Demographics by Child Poverty Among Boys Under 16
Demographics Similar to Northern Europeans by Child Poverty Among Boys Under 16
In terms of child poverty among boys under 16, the demographic groups most similar to Northern Europeans are Immigrants from North America (14.8%, a difference of 0.020%), German (14.8%, a difference of 0.050%), Immigrants from Argentina (14.8%, a difference of 0.090%), Austrian (14.8%, a difference of 0.10%), and Taiwanese (14.8%, a difference of 0.12%).
| Demographics | Rating | Rank | Child Poverty Among Boys Under 16 |
| Immigrants | Russia | 97.7 /100 | #80 | Exceptional 14.7% |
| Immigrants | Canada | 97.6 /100 | #81 | Exceptional 14.7% |
| Ukrainians | 97.6 /100 | #82 | Exceptional 14.7% |
| Immigrants | South Africa | 97.4 /100 | #83 | Exceptional 14.8% |
| Swiss | 97.3 /100 | #84 | Exceptional 14.8% |
| Taiwanese | 97.3 /100 | #85 | Exceptional 14.8% |
| Germans | 97.2 /100 | #86 | Exceptional 14.8% |
| Northern Europeans | 97.2 /100 | #87 | Exceptional 14.8% |
| Immigrants | North America | 97.1 /100 | #88 | Exceptional 14.8% |
| Immigrants | Argentina | 97.1 /100 | #89 | Exceptional 14.8% |
| Austrians | 97.1 /100 | #90 | Exceptional 14.8% |
| Paraguayans | 96.8 /100 | #91 | Exceptional 14.9% |
| Argentineans | 96.7 /100 | #92 | Exceptional 14.9% |
| Sri Lankans | 96.7 /100 | #93 | Exceptional 14.9% |
| Immigrants | Italy | 96.7 /100 | #94 | Exceptional 14.9% |
Demographics Similar to Assyrians/Chaldeans/Syriacs by Child Poverty Among Boys Under 16
In terms of child poverty among boys under 16, the demographic groups most similar to Assyrians/Chaldeans/Syriacs are Danish (13.6%, a difference of 0.11%), Immigrants from China (13.6%, a difference of 0.29%), Turkish (13.6%, a difference of 0.38%), Swedish (13.6%, a difference of 0.46%), and Cypriot (13.6%, a difference of 0.55%).
| Demographics | Rating | Rank | Child Poverty Among Boys Under 16 |
| Asians | 99.8 /100 | #27 | Exceptional 13.5% |
| Eastern Europeans | 99.8 /100 | #28 | Exceptional 13.5% |
| Cypriots | 99.8 /100 | #29 | Exceptional 13.6% |
| Swedes | 99.8 /100 | #30 | Exceptional 13.6% |
| Turks | 99.8 /100 | #31 | Exceptional 13.6% |
| Immigrants | China | 99.8 /100 | #32 | Exceptional 13.6% |
| Danes | 99.8 /100 | #33 | Exceptional 13.6% |
| Assyrians/Chaldeans/Syriacs | 99.8 /100 | #34 | Exceptional 13.6% |
| Russians | 99.7 /100 | #35 | Exceptional 13.8% |
| Luxembourgers | 99.7 /100 | #36 | Exceptional 13.8% |
| Immigrants | Sri Lanka | 99.6 /100 | #37 | Exceptional 13.9% |
| Immigrants | Northern Europe | 99.6 /100 | #38 | Exceptional 13.9% |
| Immigrants | Australia | 99.6 /100 | #39 | Exceptional 13.9% |
| Immigrants | Asia | 99.6 /100 | #40 | Exceptional 13.9% |
| Lithuanians | 99.6 /100 | #41 | Exceptional 14.0% |