Nonimmigrants vs Ute Single Male Poverty
COMPARE
Nonimmigrants
Ute
Single Male Poverty
Single Male Poverty Comparison
Nonimmigrants
Ute
14.6%
SINGLE MALE POVERTY
0.0/ 100
METRIC RATING
292nd/ 347
METRIC RANK
15.7%
SINGLE MALE POVERTY
0.0/ 100
METRIC RATING
307th/ 347
METRIC RANK
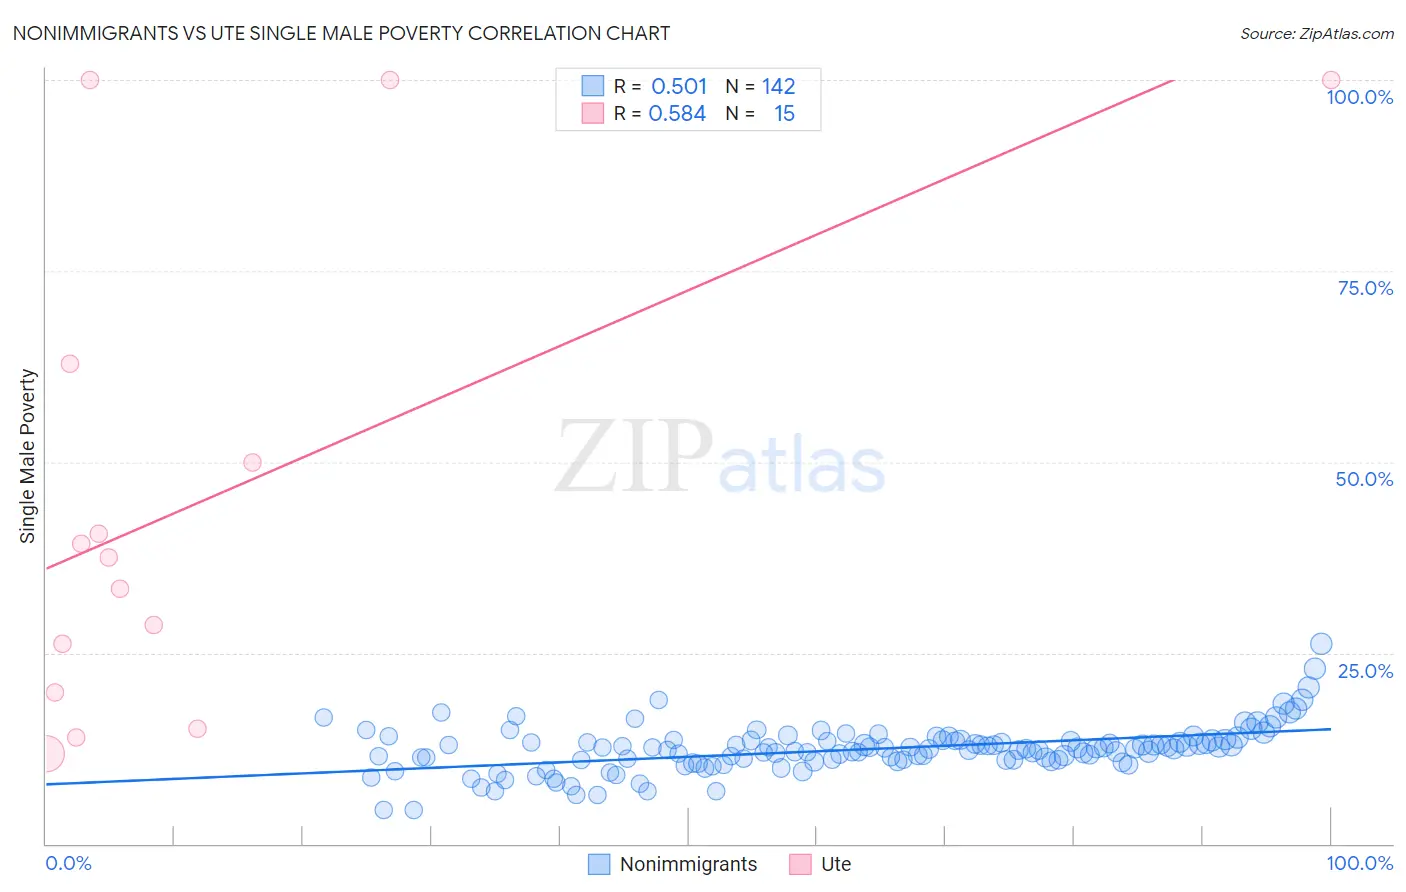
Nonimmigrants vs Ute Single Male Poverty Correlation Chart
The statistical analysis conducted on geographies consisting of 470,347,723 people shows a substantial positive correlation between the proportion of Nonimmigrants and poverty level among single males in the United States with a correlation coefficient (R) of 0.501 and weighted average of 14.6%. Similarly, the statistical analysis conducted on geographies consisting of 54,243,903 people shows a substantial positive correlation between the proportion of Ute and poverty level among single males in the United States with a correlation coefficient (R) of 0.584 and weighted average of 15.7%, a difference of 7.6%.
Single Male Poverty Correlation Summary
| Measurement | Nonimmigrants | Ute |
| Minimum | 4.4% | 11.8% |
| Maximum | 26.2% | 100.0% |
| Range | 21.8% | 88.2% |
| Mean | 12.4% | 45.2% |
| Median | 12.5% | 37.4% |
| Interquartile 25% (IQ1) | 11.0% | 19.9% |
| Interquartile 75% (IQ3) | 13.5% | 62.8% |
| Interquartile Range (IQR) | 2.5% | 42.9% |
| Standard Deviation (Sample) | 3.1% | 31.5% |
| Standard Deviation (Population) | 3.1% | 30.4% |
Demographics Similar to Nonimmigrants and Ute by Single Male Poverty
In terms of single male poverty, the demographic groups most similar to Nonimmigrants are French Canadian (14.6%, a difference of 0.11%), Bahamian (14.6%, a difference of 0.13%), U.S. Virgin Islander (14.5%, a difference of 0.28%), Ottawa (14.6%, a difference of 0.30%), and Immigrants from Dominica (14.5%, a difference of 0.51%). Similarly, the demographic groups most similar to Ute are Potawatomi (15.8%, a difference of 0.57%), American (15.8%, a difference of 0.73%), Pennsylvania German (15.6%, a difference of 0.75%), Blackfeet (15.5%, a difference of 1.2%), and Alaska Native (15.4%, a difference of 1.7%).
| Demographics | Rating | Rank | Single Male Poverty |
| Immigrants | Dominica | 0.0 /100 | #289 | Tragic 14.5% |
| U.S. Virgin Islanders | 0.0 /100 | #290 | Tragic 14.5% |
| Bahamians | 0.0 /100 | #291 | Tragic 14.6% |
| Immigrants | Nonimmigrants | 0.0 /100 | #292 | Tragic 14.6% |
| French Canadians | 0.0 /100 | #293 | Tragic 14.6% |
| Ottawa | 0.0 /100 | #294 | Tragic 14.6% |
| Scotch-Irish | 0.0 /100 | #295 | Tragic 14.7% |
| Africans | 0.0 /100 | #296 | Tragic 14.7% |
| Immigrants | Dominican Republic | 0.0 /100 | #297 | Tragic 14.8% |
| French American Indians | 0.0 /100 | #298 | Tragic 15.0% |
| Delaware | 0.0 /100 | #299 | Tragic 15.0% |
| Cree | 0.0 /100 | #300 | Tragic 15.1% |
| Dominicans | 0.0 /100 | #301 | Tragic 15.2% |
| Alsatians | 0.0 /100 | #302 | Tragic 15.2% |
| Aleuts | 0.0 /100 | #303 | Tragic 15.4% |
| Alaska Natives | 0.0 /100 | #304 | Tragic 15.4% |
| Blackfeet | 0.0 /100 | #305 | Tragic 15.5% |
| Pennsylvania Germans | 0.0 /100 | #306 | Tragic 15.6% |
| Ute | 0.0 /100 | #307 | Tragic 15.7% |
| Potawatomi | 0.0 /100 | #308 | Tragic 15.8% |
| Americans | 0.0 /100 | #309 | Tragic 15.8% |