Nonimmigrants vs Immigrants Child Poverty Under the Age of 16
COMPARE
Nonimmigrants
Immigrants
Child Poverty Under the Age of 16
Child Poverty Under the Age of 16 Comparison
Nonimmigrants
Immigrants
17.9%
CHILD POVERTY UNDER THE AGE OF 16
2.7/ 100
METRIC RATING
225th/ 347
METRIC RANK
17.5%
CHILD POVERTY UNDER THE AGE OF 16
6.5/ 100
METRIC RATING
212th/ 347
METRIC RANK
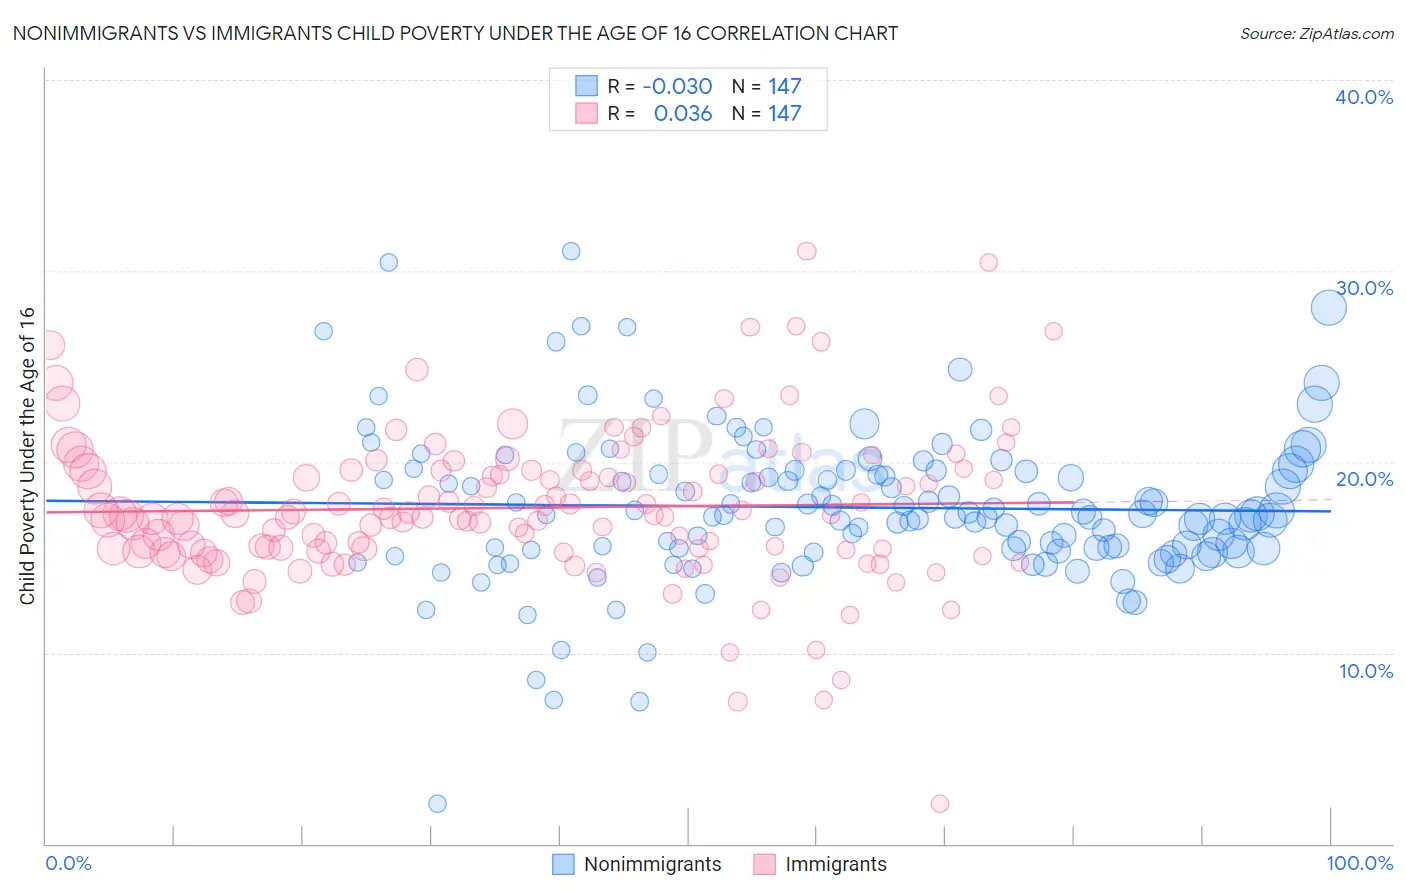
Nonimmigrants vs Immigrants Child Poverty Under the Age of 16 Correlation Chart
The statistical analysis conducted on geographies consisting of 569,879,653 people shows no correlation between the proportion of Nonimmigrants and poverty level among children under the age of 16 in the United States with a correlation coefficient (R) of -0.030 and weighted average of 17.9%. Similarly, the statistical analysis conducted on geographies consisting of 564,478,832 people shows no correlation between the proportion of Immigrants and poverty level among children under the age of 16 in the United States with a correlation coefficient (R) of 0.036 and weighted average of 17.5%, a difference of 2.6%.
Child Poverty Under the Age of 16 Correlation Summary
| Measurement | Nonimmigrants | Immigrants |
| Minimum | 2.1% | 2.1% |
| Maximum | 31.1% | 31.1% |
| Range | 29.0% | 29.0% |
| Mean | 17.6% | 17.6% |
| Median | 17.2% | 17.2% |
| Interquartile 25% (IQ1) | 15.4% | 15.4% |
| Interquartile 75% (IQ3) | 19.5% | 19.6% |
| Interquartile Range (IQR) | 4.2% | 4.2% |
| Standard Deviation (Sample) | 4.1% | 4.0% |
| Standard Deviation (Population) | 4.0% | 4.0% |
Demographics Similar to Nonimmigrants and Immigrants by Child Poverty Under the Age of 16
In terms of child poverty under the age of 16, the demographic groups most similar to Nonimmigrants are Bermudan (18.0%, a difference of 0.070%), Immigrants from Africa (18.0%, a difference of 0.25%), Osage (17.9%, a difference of 0.36%), Immigrants from Micronesia (18.0%, a difference of 0.40%), and Immigrants from Cambodia (17.8%, a difference of 0.60%). Similarly, the demographic groups most similar to Immigrants are Immigrants from Thailand (17.5%, a difference of 0.020%), Alaskan Athabascan (17.5%, a difference of 0.15%), Panamanian (17.5%, a difference of 0.16%), Immigrants from the Azores (17.5%, a difference of 0.17%), and Iraqi (17.5%, a difference of 0.29%).
| Demographics | Rating | Rank | Child Poverty Under the Age of 16 |
| Pennsylvania Germans | 7.5 /100 | #208 | Tragic 17.4% |
| Panamanians | 6.9 /100 | #209 | Tragic 17.5% |
| Alaskan Athabascans | 6.9 /100 | #210 | Tragic 17.5% |
| Immigrants | Thailand | 6.6 /100 | #211 | Tragic 17.5% |
| Immigrants | Immigrants | 6.5 /100 | #212 | Tragic 17.5% |
| Immigrants | Azores | 6.2 /100 | #213 | Tragic 17.5% |
| Iraqis | 5.9 /100 | #214 | Tragic 17.5% |
| Malaysians | 5.9 /100 | #215 | Tragic 17.5% |
| Sierra Leoneans | 5.7 /100 | #216 | Tragic 17.6% |
| Immigrants | Eastern Africa | 5.3 /100 | #217 | Tragic 17.6% |
| Moroccans | 5.3 /100 | #218 | Tragic 17.6% |
| Japanese | 4.7 /100 | #219 | Tragic 17.7% |
| Immigrants | Panama | 4.1 /100 | #220 | Tragic 17.7% |
| Cubans | 3.7 /100 | #221 | Tragic 17.8% |
| Immigrants | Armenia | 3.6 /100 | #222 | Tragic 17.8% |
| Immigrants | Cambodia | 3.3 /100 | #223 | Tragic 17.8% |
| Osage | 3.1 /100 | #224 | Tragic 17.9% |
| Immigrants | Nonimmigrants | 2.7 /100 | #225 | Tragic 17.9% |
| Bermudans | 2.6 /100 | #226 | Tragic 18.0% |
| Immigrants | Africa | 2.5 /100 | #227 | Tragic 18.0% |
| Immigrants | Micronesia | 2.3 /100 | #228 | Tragic 18.0% |