Nigerian vs Immigrants from Barbados Male Poverty
COMPARE
Nigerian
Immigrants from Barbados
Male Poverty
Male Poverty Comparison
Nigerians
Immigrants from Barbados
12.3%
MALE POVERTY
1.4/ 100
METRIC RATING
226th/ 347
METRIC RANK
13.8%
MALE POVERTY
0.0/ 100
METRIC RATING
287th/ 347
METRIC RANK
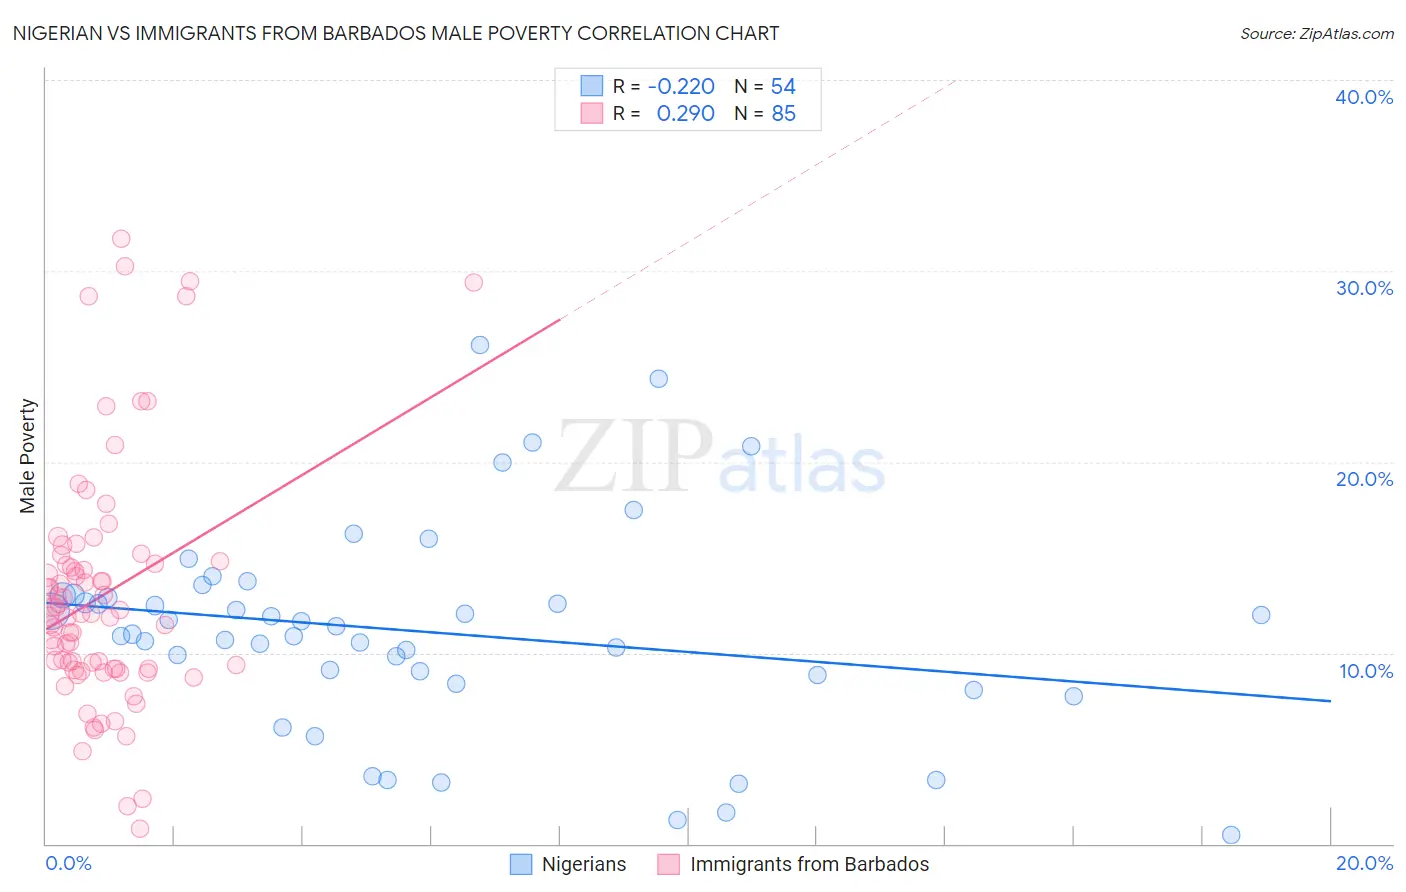
Nigerian vs Immigrants from Barbados Male Poverty Correlation Chart
The statistical analysis conducted on geographies consisting of 332,422,951 people shows a weak negative correlation between the proportion of Nigerians and poverty level among males in the United States with a correlation coefficient (R) of -0.220 and weighted average of 12.3%. Similarly, the statistical analysis conducted on geographies consisting of 112,769,360 people shows a weak positive correlation between the proportion of Immigrants from Barbados and poverty level among males in the United States with a correlation coefficient (R) of 0.290 and weighted average of 13.8%, a difference of 11.4%.
Male Poverty Correlation Summary
| Measurement | Nigerian | Immigrants from Barbados |
| Minimum | 0.49% | 0.81% |
| Maximum | 26.1% | 31.7% |
| Range | 25.6% | 30.9% |
| Mean | 11.1% | 13.0% |
| Median | 11.2% | 12.0% |
| Interquartile 25% (IQ1) | 8.9% | 9.1% |
| Interquartile 75% (IQ3) | 13.0% | 14.7% |
| Interquartile Range (IQR) | 4.1% | 5.6% |
| Standard Deviation (Sample) | 5.4% | 6.3% |
| Standard Deviation (Population) | 5.3% | 6.2% |
Similar Demographics by Male Poverty
Demographics Similar to Nigerians by Male Poverty
In terms of male poverty, the demographic groups most similar to Nigerians are Alaska Native (12.4%, a difference of 0.090%), Alsatian (12.4%, a difference of 0.13%), Osage (12.3%, a difference of 0.17%), Immigrants from Nigeria (12.3%, a difference of 0.22%), and Cuban (12.4%, a difference of 0.23%).
| Demographics | Rating | Rank | Male Poverty |
| Bermudans | 2.4 /100 | #219 | Tragic 12.2% |
| Immigrants | Eritrea | 2.4 /100 | #220 | Tragic 12.2% |
| Ugandans | 2.2 /100 | #221 | Tragic 12.2% |
| Immigrants | Africa | 2.1 /100 | #222 | Tragic 12.2% |
| Immigrants | Micronesia | 2.1 /100 | #223 | Tragic 12.2% |
| Immigrants | Nigeria | 1.6 /100 | #224 | Tragic 12.3% |
| Osage | 1.5 /100 | #225 | Tragic 12.3% |
| Nigerians | 1.4 /100 | #226 | Tragic 12.3% |
| Alaska Natives | 1.4 /100 | #227 | Tragic 12.4% |
| Alsatians | 1.3 /100 | #228 | Tragic 12.4% |
| Cubans | 1.3 /100 | #229 | Tragic 12.4% |
| Marshallese | 0.8 /100 | #230 | Tragic 12.5% |
| Salvadorans | 0.6 /100 | #231 | Tragic 12.6% |
| Nicaraguans | 0.6 /100 | #232 | Tragic 12.6% |
| Fijians | 0.6 /100 | #233 | Tragic 12.6% |
Demographics Similar to Immigrants from Barbados by Male Poverty
In terms of male poverty, the demographic groups most similar to Immigrants from Barbados are Shoshone (13.8%, a difference of 0.020%), West Indian (13.8%, a difference of 0.050%), Immigrants from Haiti (13.8%, a difference of 0.060%), Comanche (13.8%, a difference of 0.070%), and Immigrants from St. Vincent and the Grenadines (13.8%, a difference of 0.17%).
| Demographics | Rating | Rank | Male Poverty |
| Mexicans | 0.0 /100 | #280 | Tragic 13.7% |
| Yaqui | 0.0 /100 | #281 | Tragic 13.7% |
| Immigrants | Cabo Verde | 0.0 /100 | #282 | Tragic 13.7% |
| Comanche | 0.0 /100 | #283 | Tragic 13.8% |
| Immigrants | Haiti | 0.0 /100 | #284 | Tragic 13.8% |
| West Indians | 0.0 /100 | #285 | Tragic 13.8% |
| Shoshone | 0.0 /100 | #286 | Tragic 13.8% |
| Immigrants | Barbados | 0.0 /100 | #287 | Tragic 13.8% |
| Immigrants | St. Vincent and the Grenadines | 0.0 /100 | #288 | Tragic 13.8% |
| Guatemalans | 0.0 /100 | #289 | Tragic 13.8% |
| Immigrants | Zaire | 0.0 /100 | #290 | Tragic 13.8% |
| Vietnamese | 0.0 /100 | #291 | Tragic 13.8% |
| Indonesians | 0.0 /100 | #292 | Tragic 13.8% |
| Immigrants | Belize | 0.0 /100 | #293 | Tragic 13.8% |
| Hispanics or Latinos | 0.0 /100 | #294 | Tragic 13.9% |