Nicaraguan vs Iranian Single Father Poverty
COMPARE
Nicaraguan
Iranian
Single Father Poverty
Single Father Poverty Comparison
Nicaraguans
Iranians
15.9%
SINGLE FATHER POVERTY
90.1/ 100
METRIC RATING
131st/ 347
METRIC RANK
14.4%
SINGLE FATHER POVERTY
100.0/ 100
METRIC RATING
25th/ 347
METRIC RANK
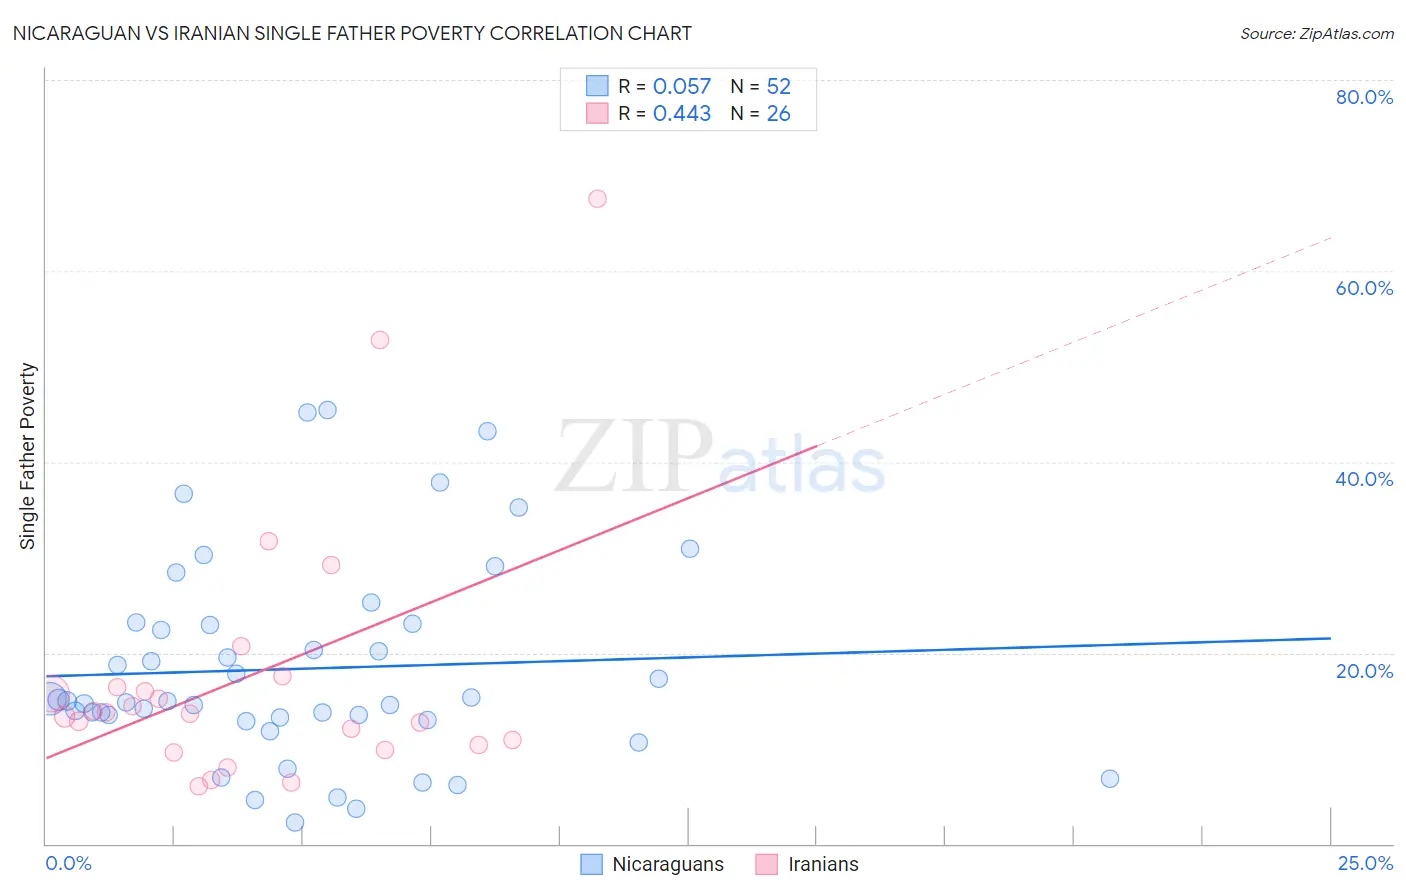
Nicaraguan vs Iranian Single Father Poverty Correlation Chart
The statistical analysis conducted on geographies consisting of 241,925,601 people shows a slight positive correlation between the proportion of Nicaraguans and poverty level among single fathers in the United States with a correlation coefficient (R) of 0.057 and weighted average of 15.9%. Similarly, the statistical analysis conducted on geographies consisting of 254,379,311 people shows a moderate positive correlation between the proportion of Iranians and poverty level among single fathers in the United States with a correlation coefficient (R) of 0.443 and weighted average of 14.4%, a difference of 10.7%.
Single Father Poverty Correlation Summary
| Measurement | Nicaraguan | Iranian |
| Minimum | 2.2% | 6.0% |
| Maximum | 45.5% | 67.6% |
| Range | 43.2% | 61.6% |
| Mean | 18.3% | 17.6% |
| Median | 15.0% | 13.7% |
| Interquartile 25% (IQ1) | 13.1% | 10.3% |
| Interquartile 75% (IQ3) | 23.0% | 16.4% |
| Interquartile Range (IQR) | 9.9% | 6.1% |
| Standard Deviation (Sample) | 10.6% | 14.1% |
| Standard Deviation (Population) | 10.5% | 13.8% |
Similar Demographics by Single Father Poverty
Demographics Similar to Nicaraguans by Single Father Poverty
In terms of single father poverty, the demographic groups most similar to Nicaraguans are Norwegian (15.9%, a difference of 0.0%), Immigrants from Portugal (15.9%, a difference of 0.060%), Immigrants from Syria (15.9%, a difference of 0.070%), Immigrants from West Indies (15.9%, a difference of 0.080%), and Immigrants from Nigeria (15.9%, a difference of 0.090%).
| Demographics | Rating | Rank | Single Father Poverty |
| Immigrants | Panama | 91.3 /100 | #124 | Exceptional 15.9% |
| Iraqis | 91.2 /100 | #125 | Exceptional 15.9% |
| Hmong | 91.1 /100 | #126 | Exceptional 15.9% |
| Immigrants | Liberia | 91.1 /100 | #127 | Exceptional 15.9% |
| Immigrants | Nigeria | 90.8 /100 | #128 | Exceptional 15.9% |
| Immigrants | West Indies | 90.8 /100 | #129 | Exceptional 15.9% |
| Norwegians | 90.2 /100 | #130 | Exceptional 15.9% |
| Nicaraguans | 90.1 /100 | #131 | Exceptional 15.9% |
| Immigrants | Portugal | 89.7 /100 | #132 | Excellent 15.9% |
| Immigrants | Syria | 89.5 /100 | #133 | Excellent 15.9% |
| Immigrants | South America | 88.5 /100 | #134 | Excellent 15.9% |
| Immigrants | Sri Lanka | 88.2 /100 | #135 | Excellent 15.9% |
| Cypriots | 87.5 /100 | #136 | Excellent 15.9% |
| Immigrants | Azores | 87.2 /100 | #137 | Excellent 15.9% |
| Central Americans | 87.1 /100 | #138 | Excellent 16.0% |
Demographics Similar to Iranians by Single Father Poverty
In terms of single father poverty, the demographic groups most similar to Iranians are Immigrants from South Eastern Asia (14.4%, a difference of 0.030%), Immigrants from Egypt (14.4%, a difference of 0.040%), Taiwanese (14.3%, a difference of 0.25%), Spanish American Indian (14.4%, a difference of 0.42%), and Nepalese (14.4%, a difference of 0.48%).
| Demographics | Rating | Rank | Single Father Poverty |
| Soviet Union | 100.0 /100 | #18 | Exceptional 14.3% |
| Immigrants | Iraq | 100.0 /100 | #19 | Exceptional 14.3% |
| Immigrants | Singapore | 100.0 /100 | #20 | Exceptional 14.3% |
| Immigrants | Afghanistan | 100.0 /100 | #21 | Exceptional 14.3% |
| Taiwanese | 100.0 /100 | #22 | Exceptional 14.3% |
| Immigrants | Egypt | 100.0 /100 | #23 | Exceptional 14.4% |
| Immigrants | South Eastern Asia | 100.0 /100 | #24 | Exceptional 14.4% |
| Iranians | 100.0 /100 | #25 | Exceptional 14.4% |
| Spanish American Indians | 100.0 /100 | #26 | Exceptional 14.4% |
| Nepalese | 100.0 /100 | #27 | Exceptional 14.4% |
| Immigrants | South Central Asia | 100.0 /100 | #28 | Exceptional 14.5% |
| Somalis | 100.0 /100 | #29 | Exceptional 14.5% |
| Thais | 100.0 /100 | #30 | Exceptional 14.5% |
| Icelanders | 100.0 /100 | #31 | Exceptional 14.5% |
| Asians | 100.0 /100 | #32 | Exceptional 14.6% |