Nicaraguan vs Cape Verdean Receiving Food Stamps
COMPARE
Nicaraguan
Cape Verdean
Receiving Food Stamps
Receiving Food Stamps Comparison
Nicaraguans
Cape Verdeans
16.1%
RECEIVING FOOD STAMPS
0.0/ 100
METRIC RATING
303rd/ 347
METRIC RANK
21.1%
RECEIVING FOOD STAMPS
0.0/ 100
METRIC RATING
337th/ 347
METRIC RANK
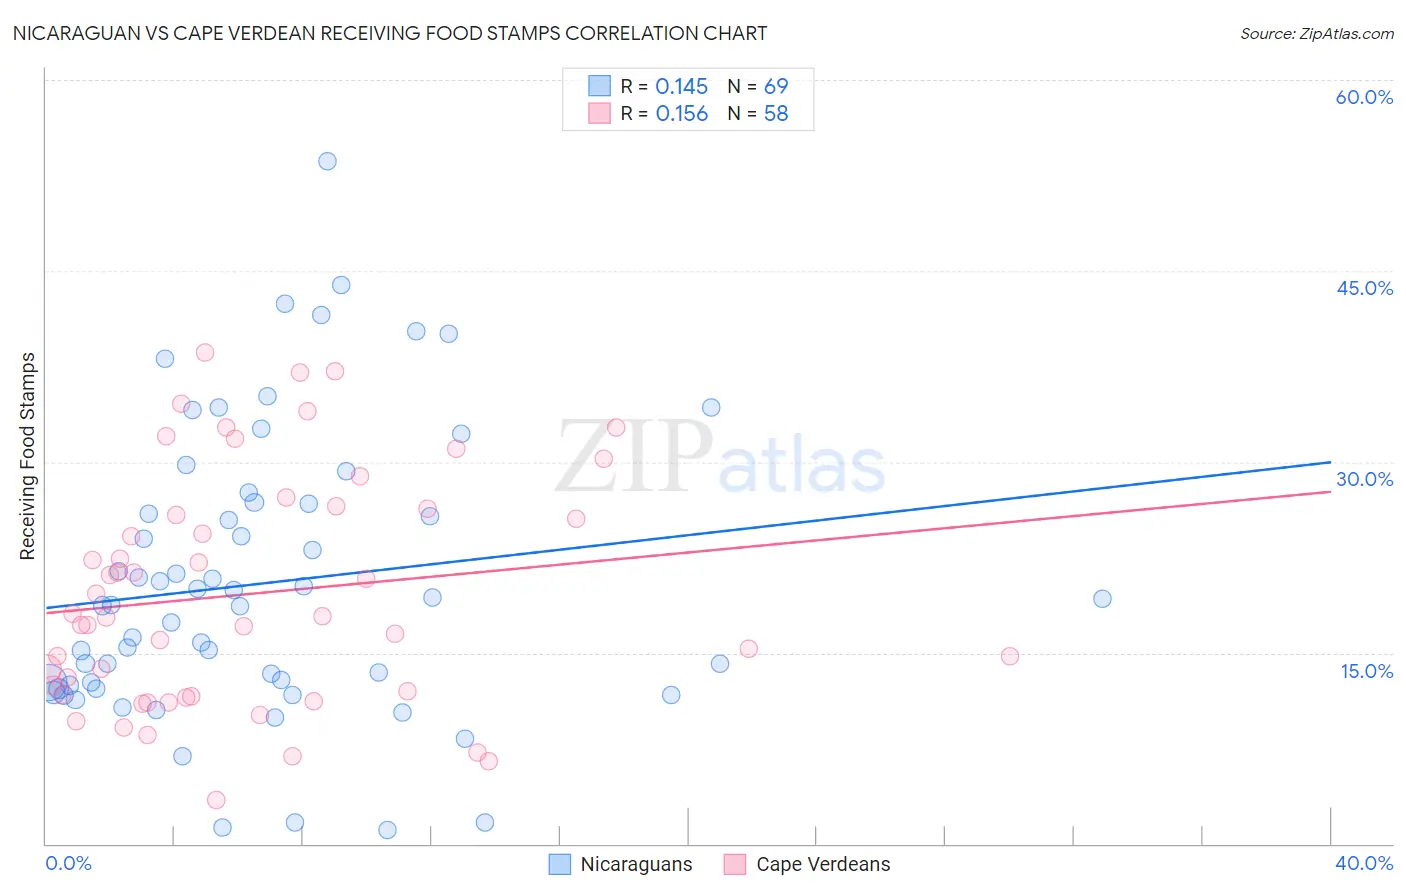
Nicaraguan vs Cape Verdean Receiving Food Stamps Correlation Chart
The statistical analysis conducted on geographies consisting of 285,345,977 people shows a poor positive correlation between the proportion of Nicaraguans and percentage of population receiving government assistance and/or food stamps in the United States with a correlation coefficient (R) of 0.145 and weighted average of 16.1%. Similarly, the statistical analysis conducted on geographies consisting of 107,485,738 people shows a poor positive correlation between the proportion of Cape Verdeans and percentage of population receiving government assistance and/or food stamps in the United States with a correlation coefficient (R) of 0.156 and weighted average of 21.1%, a difference of 30.5%.
Receiving Food Stamps Correlation Summary
| Measurement | Nicaraguan | Cape Verdean |
| Minimum | 1.1% | 3.4% |
| Maximum | 53.6% | 38.6% |
| Range | 52.5% | 35.2% |
| Mean | 20.4% | 19.6% |
| Median | 18.7% | 17.8% |
| Interquartile 25% (IQ1) | 12.3% | 11.7% |
| Interquartile 75% (IQ3) | 26.7% | 26.3% |
| Interquartile Range (IQR) | 14.4% | 14.6% |
| Standard Deviation (Sample) | 11.2% | 9.0% |
| Standard Deviation (Population) | 11.1% | 9.0% |
Similar Demographics by Receiving Food Stamps
Demographics Similar to Nicaraguans by Receiving Food Stamps
In terms of receiving food stamps, the demographic groups most similar to Nicaraguans are Immigrants from West Indies (16.1%, a difference of 0.090%), West Indian (16.3%, a difference of 0.68%), Trinidadian and Tobagonian (16.0%, a difference of 1.0%), Immigrants from Bangladesh (15.9%, a difference of 1.5%), and Immigrants from the Azores (16.4%, a difference of 1.6%).
| Demographics | Rating | Rank | Receiving Food Stamps |
| Tsimshian | 0.0 /100 | #296 | Tragic 15.7% |
| Immigrants | Bahamas | 0.0 /100 | #297 | Tragic 15.8% |
| Immigrants | Trinidad and Tobago | 0.0 /100 | #298 | Tragic 15.8% |
| Hispanics or Latinos | 0.0 /100 | #299 | Tragic 15.8% |
| Immigrants | Bangladesh | 0.0 /100 | #300 | Tragic 15.9% |
| Trinidadians and Tobagonians | 0.0 /100 | #301 | Tragic 16.0% |
| Immigrants | West Indies | 0.0 /100 | #302 | Tragic 16.1% |
| Nicaraguans | 0.0 /100 | #303 | Tragic 16.1% |
| West Indians | 0.0 /100 | #304 | Tragic 16.3% |
| Immigrants | Azores | 0.0 /100 | #305 | Tragic 16.4% |
| Jamaicans | 0.0 /100 | #306 | Tragic 16.4% |
| Houma | 0.0 /100 | #307 | Tragic 16.5% |
| Barbadians | 0.0 /100 | #308 | Tragic 16.5% |
| U.S. Virgin Islanders | 0.0 /100 | #309 | Tragic 16.5% |
| Immigrants | Barbados | 0.0 /100 | #310 | Tragic 16.6% |
Demographics Similar to Cape Verdeans by Receiving Food Stamps
In terms of receiving food stamps, the demographic groups most similar to Cape Verdeans are Navajo (21.1%, a difference of 0.060%), Immigrants from Cuba (20.8%, a difference of 1.2%), Dominican (21.4%, a difference of 1.4%), Yakama (21.4%, a difference of 1.7%), and Tohono O'odham (21.5%, a difference of 1.9%).
| Demographics | Rating | Rank | Receiving Food Stamps |
| Pima | 0.0 /100 | #330 | Tragic 19.0% |
| Immigrants | Caribbean | 0.0 /100 | #331 | Tragic 19.6% |
| Pueblo | 0.0 /100 | #332 | Tragic 19.9% |
| Inupiat | 0.0 /100 | #333 | Tragic 20.1% |
| Yuman | 0.0 /100 | #334 | Tragic 20.2% |
| Immigrants | Cuba | 0.0 /100 | #335 | Tragic 20.8% |
| Navajo | 0.0 /100 | #336 | Tragic 21.1% |
| Cape Verdeans | 0.0 /100 | #337 | Tragic 21.1% |
| Dominicans | 0.0 /100 | #338 | Tragic 21.4% |
| Yakama | 0.0 /100 | #339 | Tragic 21.4% |
| Tohono O'odham | 0.0 /100 | #340 | Tragic 21.5% |
| Hopi | 0.0 /100 | #341 | Tragic 21.6% |
| Immigrants | Yemen | 0.0 /100 | #342 | Tragic 21.6% |
| Immigrants | Dominican Republic | 0.0 /100 | #343 | Tragic 22.1% |
| Lumbee | 0.0 /100 | #344 | Tragic 22.9% |