Nepalese vs Cambodian Female Poverty Among 18-24 Year Olds
COMPARE
Nepalese
Cambodian
Female Poverty Among 18-24 Year Olds
Female Poverty Among 18-24 Year Olds Comparison
Nepalese
Cambodians
20.2%
FEMALE POVERTY AMONG 18-24 YEAR OLDS
39.7/ 100
METRIC RATING
185th/ 347
METRIC RANK
19.4%
FEMALE POVERTY AMONG 18-24 YEAR OLDS
94.6/ 100
METRIC RATING
122nd/ 347
METRIC RANK
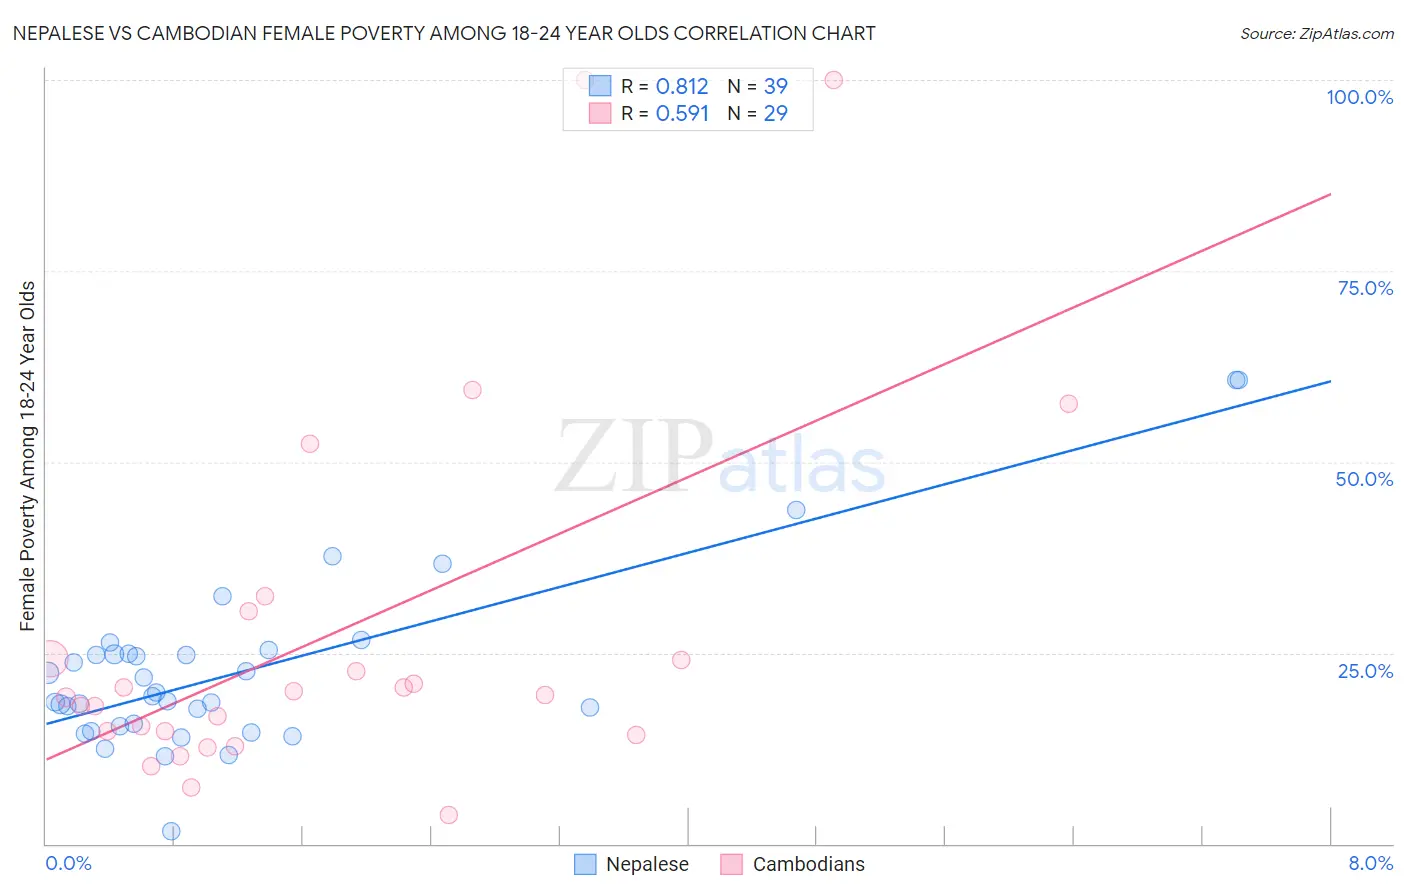
Nepalese vs Cambodian Female Poverty Among 18-24 Year Olds Correlation Chart
The statistical analysis conducted on geographies consisting of 24,489,423 people shows a very strong positive correlation between the proportion of Nepalese and poverty level among females between the ages 18 and 24 in the United States with a correlation coefficient (R) of 0.812 and weighted average of 20.2%. Similarly, the statistical analysis conducted on geographies consisting of 101,940,154 people shows a substantial positive correlation between the proportion of Cambodians and poverty level among females between the ages 18 and 24 in the United States with a correlation coefficient (R) of 0.591 and weighted average of 19.4%, a difference of 4.2%.
Female Poverty Among 18-24 Year Olds Correlation Summary
| Measurement | Nepalese | Cambodian |
| Minimum | 1.6% | 3.8% |
| Maximum | 60.7% | 100.0% |
| Range | 59.1% | 96.2% |
| Mean | 22.8% | 27.4% |
| Median | 19.4% | 19.4% |
| Interquartile 25% (IQ1) | 15.3% | 14.5% |
| Interquartile 75% (IQ3) | 24.9% | 27.4% |
| Interquartile Range (IQR) | 9.6% | 12.8% |
| Standard Deviation (Sample) | 11.9% | 24.2% |
| Standard Deviation (Population) | 11.7% | 23.8% |
Similar Demographics by Female Poverty Among 18-24 Year Olds
Demographics Similar to Nepalese by Female Poverty Among 18-24 Year Olds
In terms of female poverty among 18-24 year olds, the demographic groups most similar to Nepalese are Immigrants from Central America (20.2%, a difference of 0.010%), Lebanese (20.2%, a difference of 0.040%), Immigrants from Ethiopia (20.2%, a difference of 0.12%), Immigrants from China (20.2%, a difference of 0.16%), and Immigrants from Barbados (20.2%, a difference of 0.16%).
| Demographics | Rating | Rank | Female Poverty Among 18-24 Year Olds |
| Swiss | 44.0 /100 | #178 | Average 20.2% |
| Ethiopians | 43.8 /100 | #179 | Average 20.2% |
| Iraqis | 43.3 /100 | #180 | Average 20.2% |
| Immigrants | China | 43.0 /100 | #181 | Average 20.2% |
| Immigrants | Barbados | 42.8 /100 | #182 | Average 20.2% |
| Lebanese | 40.6 /100 | #183 | Average 20.2% |
| Immigrants | Central America | 39.9 /100 | #184 | Fair 20.2% |
| Nepalese | 39.7 /100 | #185 | Fair 20.2% |
| Immigrants | Ethiopia | 37.3 /100 | #186 | Fair 20.2% |
| Immigrants | Mexico | 36.3 /100 | #187 | Fair 20.2% |
| Scandinavians | 34.6 /100 | #188 | Fair 20.3% |
| Immigrants | Germany | 34.0 /100 | #189 | Fair 20.3% |
| Immigrants | Western Asia | 29.3 /100 | #190 | Fair 20.3% |
| Moroccans | 25.8 /100 | #191 | Fair 20.4% |
| Immigrants | Israel | 24.4 /100 | #192 | Fair 20.4% |
Demographics Similar to Cambodians by Female Poverty Among 18-24 Year Olds
In terms of female poverty among 18-24 year olds, the demographic groups most similar to Cambodians are Paraguayan (19.4%, a difference of 0.010%), Immigrants from Chile (19.4%, a difference of 0.070%), Immigrants from Panama (19.4%, a difference of 0.14%), Guyanese (19.4%, a difference of 0.19%), and Immigrants from Russia (19.4%, a difference of 0.20%).
| Demographics | Rating | Rank | Female Poverty Among 18-24 Year Olds |
| Immigrants | Hungary | 96.2 /100 | #115 | Exceptional 19.3% |
| Immigrants | Immigrants | 95.9 /100 | #116 | Exceptional 19.3% |
| Immigrants | Iran | 95.8 /100 | #117 | Exceptional 19.3% |
| Immigrants | Guyana | 95.6 /100 | #118 | Exceptional 19.3% |
| Cypriots | 95.5 /100 | #119 | Exceptional 19.3% |
| Immigrants | Northern Europe | 95.4 /100 | #120 | Exceptional 19.4% |
| Guyanese | 95.3 /100 | #121 | Exceptional 19.4% |
| Cambodians | 94.6 /100 | #122 | Exceptional 19.4% |
| Paraguayans | 94.6 /100 | #123 | Exceptional 19.4% |
| Immigrants | Chile | 94.3 /100 | #124 | Exceptional 19.4% |
| Immigrants | Panama | 94.0 /100 | #125 | Exceptional 19.4% |
| Immigrants | Russia | 93.7 /100 | #126 | Exceptional 19.4% |
| Cape Verdeans | 93.6 /100 | #127 | Exceptional 19.4% |
| Slovaks | 92.9 /100 | #128 | Exceptional 19.5% |
| Immigrants | England | 92.9 /100 | #129 | Exceptional 19.5% |