Navajo vs Slavic Child Poverty Under the Age of 16
COMPARE
Navajo
Slavic
Child Poverty Under the Age of 16
Child Poverty Under the Age of 16 Comparison
Navajo
Slavs
30.2%
CHILD POVERTY UNDER THE AGE OF 16
0.0/ 100
METRIC RATING
344th/ 347
METRIC RANK
15.4%
CHILD POVERTY UNDER THE AGE OF 16
84.2/ 100
METRIC RATING
141st/ 347
METRIC RANK
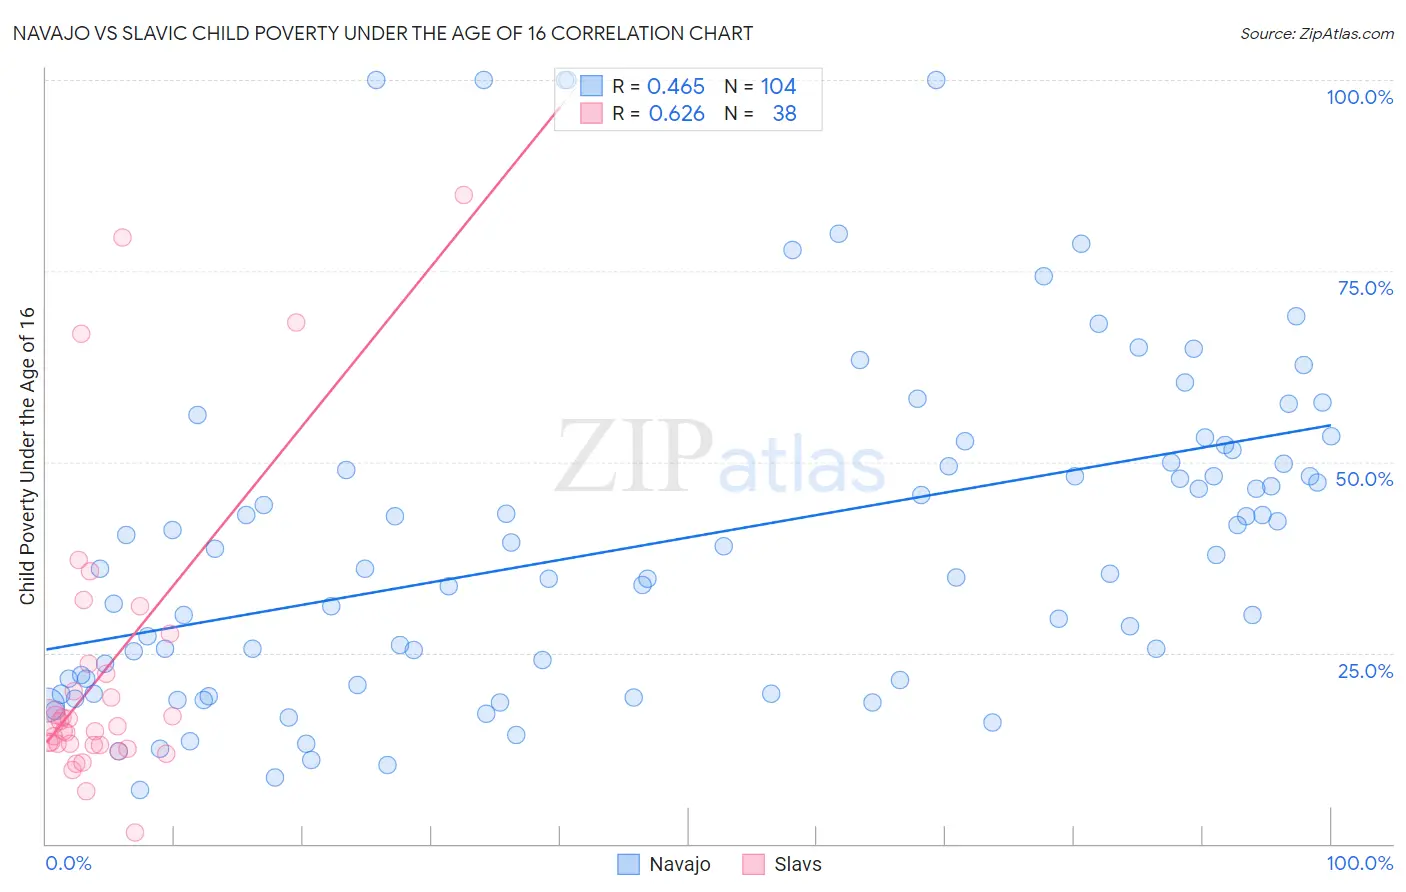
Navajo vs Slavic Child Poverty Under the Age of 16 Correlation Chart
The statistical analysis conducted on geographies consisting of 224,099,770 people shows a moderate positive correlation between the proportion of Navajo and poverty level among children under the age of 16 in the United States with a correlation coefficient (R) of 0.465 and weighted average of 30.2%. Similarly, the statistical analysis conducted on geographies consisting of 268,968,300 people shows a significant positive correlation between the proportion of Slavs and poverty level among children under the age of 16 in the United States with a correlation coefficient (R) of 0.626 and weighted average of 15.4%, a difference of 96.5%.
Child Poverty Under the Age of 16 Correlation Summary
| Measurement | Navajo | Slavic |
| Minimum | 7.1% | 1.5% |
| Maximum | 100.0% | 85.0% |
| Range | 92.9% | 83.5% |
| Mean | 39.7% | 23.0% |
| Median | 36.9% | 15.7% |
| Interquartile 25% (IQ1) | 21.5% | 13.0% |
| Interquartile 75% (IQ3) | 49.9% | 23.5% |
| Interquartile Range (IQR) | 28.4% | 10.6% |
| Standard Deviation (Sample) | 22.0% | 19.7% |
| Standard Deviation (Population) | 21.9% | 19.4% |
Similar Demographics by Child Poverty Under the Age of 16
Demographics Similar to Navajo by Child Poverty Under the Age of 16
In terms of child poverty under the age of 16, the demographic groups most similar to Navajo are Lumbee (31.0%, a difference of 2.5%), Immigrants from Yemen (29.1%, a difference of 4.0%), Pima (29.0%, a difference of 4.2%), Yuman (28.9%, a difference of 4.4%), and Tohono O'odham (31.7%, a difference of 4.9%).
| Demographics | Rating | Rank | Child Poverty Under the Age of 16 |
| Immigrants | Dominican Republic | 0.0 /100 | #333 | Tragic 24.0% |
| Blacks/African Americans | 0.0 /100 | #334 | Tragic 24.4% |
| Houma | 0.0 /100 | #335 | Tragic 24.9% |
| Yup'ik | 0.0 /100 | #336 | Tragic 25.1% |
| Sioux | 0.0 /100 | #337 | Tragic 25.2% |
| Cheyenne | 0.0 /100 | #338 | Tragic 25.4% |
| Crow | 0.0 /100 | #339 | Tragic 26.0% |
| Hopi | 0.0 /100 | #340 | Tragic 27.1% |
| Yuman | 0.0 /100 | #341 | Tragic 28.9% |
| Pima | 0.0 /100 | #342 | Tragic 29.0% |
| Immigrants | Yemen | 0.0 /100 | #343 | Tragic 29.1% |
| Navajo | 0.0 /100 | #344 | Tragic 30.2% |
| Lumbee | 0.0 /100 | #345 | Tragic 31.0% |
| Tohono O'odham | 0.0 /100 | #346 | Tragic 31.7% |
| Puerto Ricans | 0.0 /100 | #347 | Tragic 32.5% |
Demographics Similar to Slavs by Child Poverty Under the Age of 16
In terms of child poverty under the age of 16, the demographic groups most similar to Slavs are Brazilian (15.4%, a difference of 0.34%), Icelander (15.4%, a difference of 0.41%), Immigrants from Hungary (15.5%, a difference of 0.53%), Immigrants from Peru (15.5%, a difference of 0.58%), and Slovak (15.5%, a difference of 0.62%).
| Demographics | Rating | Rank | Child Poverty Under the Age of 16 |
| Native Hawaiians | 88.7 /100 | #134 | Excellent 15.2% |
| Albanians | 88.6 /100 | #135 | Excellent 15.2% |
| Immigrants | Spain | 87.3 /100 | #136 | Excellent 15.3% |
| Peruvians | 87.2 /100 | #137 | Excellent 15.3% |
| Welsh | 87.2 /100 | #138 | Excellent 15.3% |
| Immigrants | Vietnam | 87.1 /100 | #139 | Excellent 15.3% |
| New Zealanders | 86.9 /100 | #140 | Excellent 15.3% |
| Slavs | 84.2 /100 | #141 | Excellent 15.4% |
| Brazilians | 82.8 /100 | #142 | Excellent 15.4% |
| Icelanders | 82.5 /100 | #143 | Excellent 15.4% |
| Immigrants | Hungary | 81.9 /100 | #144 | Excellent 15.5% |
| Immigrants | Peru | 81.7 /100 | #145 | Excellent 15.5% |
| Slovaks | 81.4 /100 | #146 | Excellent 15.5% |
| Immigrants | Kuwait | 80.5 /100 | #147 | Excellent 15.5% |
| Puget Sound Salish | 80.3 /100 | #148 | Excellent 15.5% |