Navajo vs Menominee Child Poverty Among Girls Under 16
COMPARE
Navajo
Menominee
Child Poverty Among Girls Under 16
Child Poverty Among Girls Under 16 Comparison
Navajo
Menominee
30.5%
CHILD POVERTY AMONG GIRLS UNDER 16
0.0/ 100
METRIC RATING
344th/ 347
METRIC RANK
25.0%
CHILD POVERTY AMONG GIRLS UNDER 16
0.0/ 100
METRIC RATING
334th/ 347
METRIC RANK
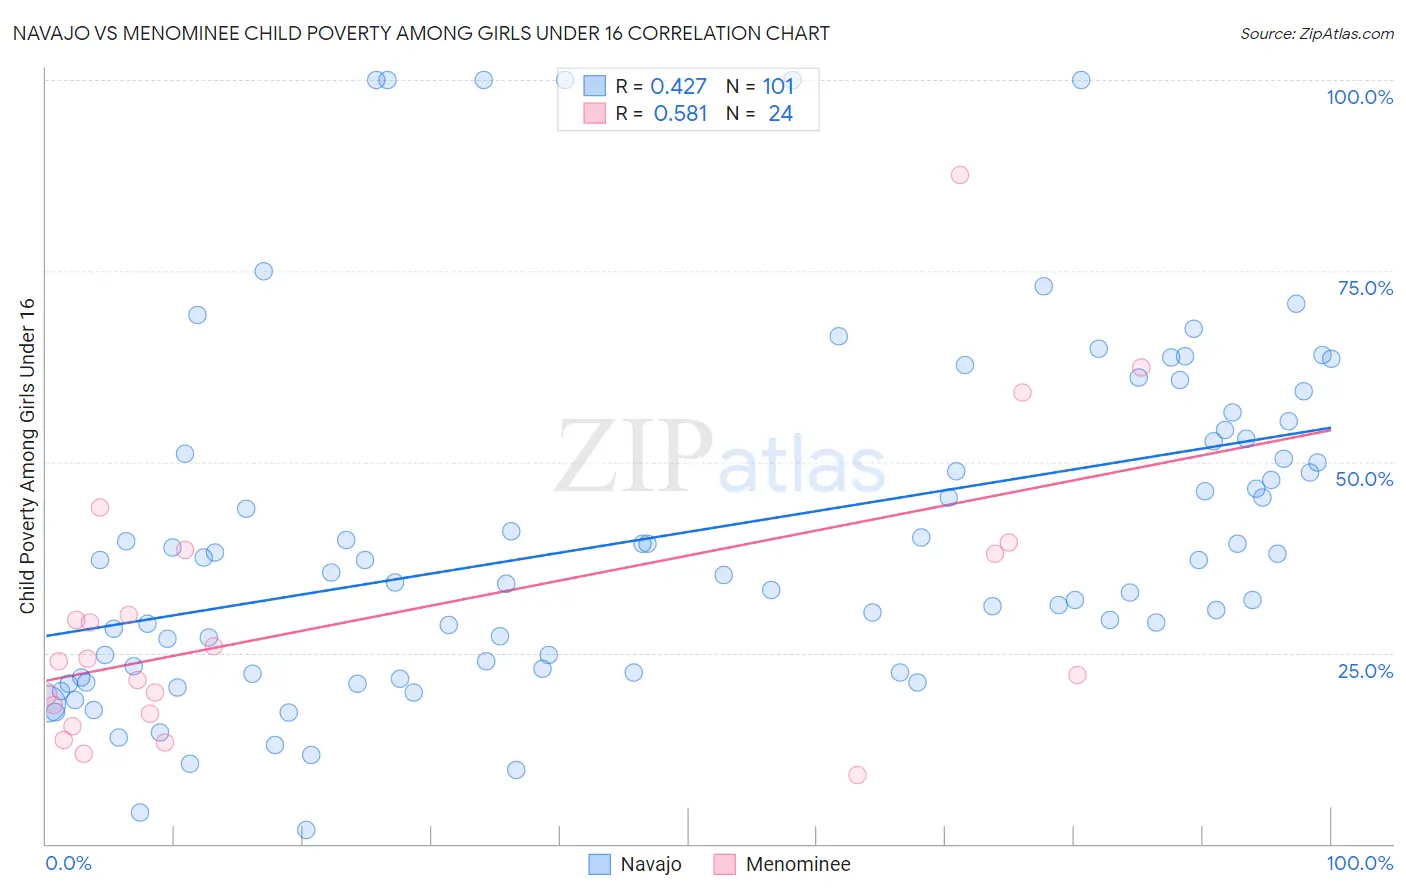
Navajo vs Menominee Child Poverty Among Girls Under 16 Correlation Chart
The statistical analysis conducted on geographies consisting of 223,292,374 people shows a moderate positive correlation between the proportion of Navajo and poverty level among girls under the age of 16 in the United States with a correlation coefficient (R) of 0.427 and weighted average of 30.5%. Similarly, the statistical analysis conducted on geographies consisting of 45,532,886 people shows a substantial positive correlation between the proportion of Menominee and poverty level among girls under the age of 16 in the United States with a correlation coefficient (R) of 0.581 and weighted average of 25.0%, a difference of 21.8%.
Child Poverty Among Girls Under 16 Correlation Summary
| Measurement | Navajo | Menominee |
| Minimum | 1.8% | 9.0% |
| Maximum | 100.0% | 87.5% |
| Range | 98.2% | 78.5% |
| Mean | 40.4% | 29.7% |
| Median | 37.1% | 24.1% |
| Interquartile 25% (IQ1) | 22.7% | 17.6% |
| Interquartile 75% (IQ3) | 52.8% | 38.2% |
| Interquartile Range (IQR) | 30.1% | 20.6% |
| Standard Deviation (Sample) | 22.5% | 18.5% |
| Standard Deviation (Population) | 22.4% | 18.1% |
Demographics Similar to Navajo and Menominee by Child Poverty Among Girls Under 16
In terms of child poverty among girls under 16, the demographic groups most similar to Navajo are Lumbee (30.7%, a difference of 0.78%), Immigrants from Yemen (29.5%, a difference of 3.3%), Tohono O'odham (31.6%, a difference of 3.7%), Puerto Rican (32.7%, a difference of 7.2%), and Pima (28.2%, a difference of 8.0%). Similarly, the demographic groups most similar to Menominee are Pueblo (25.2%, a difference of 0.70%), Black/African American (24.7%, a difference of 1.5%), Sioux (25.6%, a difference of 2.2%), Yup'ik (25.8%, a difference of 3.1%), and Native/Alaskan (24.0%, a difference of 4.1%).
| Demographics | Rating | Rank | Child Poverty Among Girls Under 16 |
| Dominicans | 0.0 /100 | #328 | Tragic 23.7% |
| Kiowa | 0.0 /100 | #329 | Tragic 23.7% |
| Immigrants | Dominican Republic | 0.0 /100 | #330 | Tragic 23.8% |
| Apache | 0.0 /100 | #331 | Tragic 23.8% |
| Natives/Alaskans | 0.0 /100 | #332 | Tragic 24.0% |
| Blacks/African Americans | 0.0 /100 | #333 | Tragic 24.7% |
| Menominee | 0.0 /100 | #334 | Tragic 25.0% |
| Pueblo | 0.0 /100 | #335 | Tragic 25.2% |
| Sioux | 0.0 /100 | #336 | Tragic 25.6% |
| Yup'ik | 0.0 /100 | #337 | Tragic 25.8% |
| Cheyenne | 0.0 /100 | #338 | Tragic 26.3% |
| Crow | 0.0 /100 | #339 | Tragic 26.4% |
| Yuman | 0.0 /100 | #340 | Tragic 27.1% |
| Hopi | 0.0 /100 | #341 | Tragic 27.9% |
| Pima | 0.0 /100 | #342 | Tragic 28.2% |
| Immigrants | Yemen | 0.0 /100 | #343 | Tragic 29.5% |
| Navajo | 0.0 /100 | #344 | Tragic 30.5% |
| Lumbee | 0.0 /100 | #345 | Tragic 30.7% |
| Tohono O'odham | 0.0 /100 | #346 | Tragic 31.6% |
| Puerto Ricans | 0.0 /100 | #347 | Tragic 32.7% |