Navajo vs Immigrants from Northern Africa Female Poverty
COMPARE
Navajo
Immigrants from Northern Africa
Female Poverty
Female Poverty Comparison
Navajo
Immigrants from Northern Africa
23.9%
FEMALE POVERTY
0.0/ 100
METRIC RATING
345th/ 347
METRIC RANK
13.2%
FEMALE POVERTY
68.8/ 100
METRIC RATING
157th/ 347
METRIC RANK
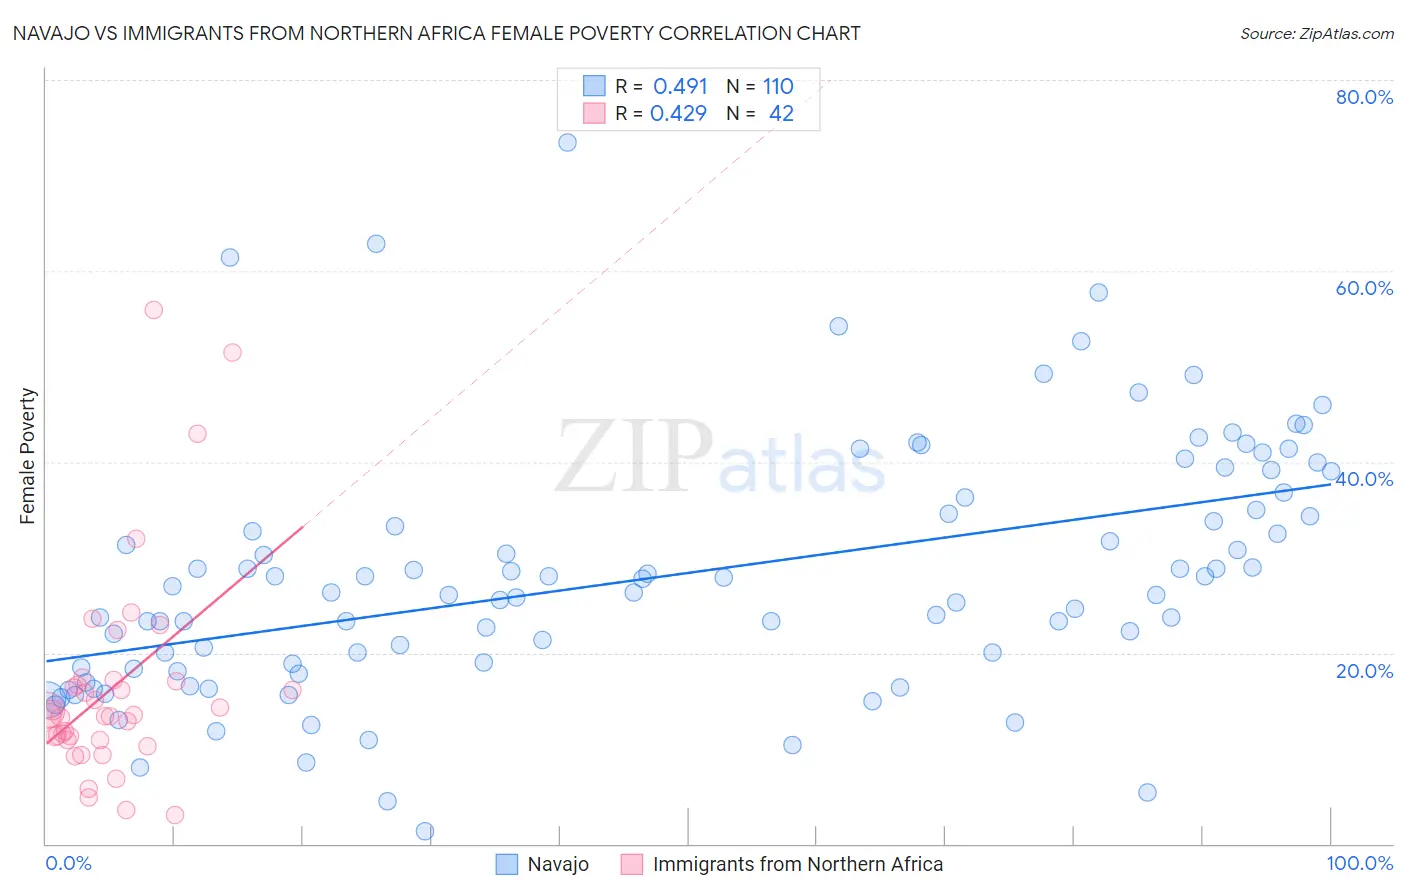
Navajo vs Immigrants from Northern Africa Female Poverty Correlation Chart
The statistical analysis conducted on geographies consisting of 224,729,638 people shows a moderate positive correlation between the proportion of Navajo and poverty level among females in the United States with a correlation coefficient (R) of 0.491 and weighted average of 23.9%. Similarly, the statistical analysis conducted on geographies consisting of 321,053,699 people shows a moderate positive correlation between the proportion of Immigrants from Northern Africa and poverty level among females in the United States with a correlation coefficient (R) of 0.429 and weighted average of 13.2%, a difference of 81.2%.
Female Poverty Correlation Summary
| Measurement | Navajo | Immigrants from Northern Africa |
| Minimum | 1.4% | 3.0% |
| Maximum | 73.5% | 55.9% |
| Range | 72.1% | 52.9% |
| Mean | 28.0% | 16.3% |
| Median | 26.3% | 13.5% |
| Interquartile 25% (IQ1) | 18.5% | 10.8% |
| Interquartile 75% (IQ3) | 34.9% | 17.0% |
| Interquartile Range (IQR) | 16.4% | 6.2% |
| Standard Deviation (Sample) | 13.1% | 11.1% |
| Standard Deviation (Population) | 13.0% | 11.0% |
Similar Demographics by Female Poverty
Demographics Similar to Navajo by Female Poverty
In terms of female poverty, the demographic groups most similar to Navajo are Pima (23.6%, a difference of 1.3%), Lumbee (23.5%, a difference of 1.6%), Immigrants from Yemen (22.8%, a difference of 4.6%), Puerto Rican (25.2%, a difference of 5.4%), and Crow (22.1%, a difference of 7.9%).
| Demographics | Rating | Rank | Female Poverty |
| Immigrants | Dominican Republic | 0.0 /100 | #333 | Tragic 19.3% |
| Houma | 0.0 /100 | #334 | Tragic 20.0% |
| Cheyenne | 0.0 /100 | #335 | Tragic 20.2% |
| Pueblo | 0.0 /100 | #336 | Tragic 20.7% |
| Yuman | 0.0 /100 | #337 | Tragic 20.8% |
| Sioux | 0.0 /100 | #338 | Tragic 20.9% |
| Hopi | 0.0 /100 | #339 | Tragic 21.0% |
| Yup'ik | 0.0 /100 | #340 | Tragic 21.5% |
| Crow | 0.0 /100 | #341 | Tragic 22.1% |
| Immigrants | Yemen | 0.0 /100 | #342 | Tragic 22.8% |
| Lumbee | 0.0 /100 | #343 | Tragic 23.5% |
| Pima | 0.0 /100 | #344 | Tragic 23.6% |
| Navajo | 0.0 /100 | #345 | Tragic 23.9% |
| Puerto Ricans | 0.0 /100 | #346 | Tragic 25.2% |
| Tohono O'odham | 0.0 /100 | #347 | Tragic 25.9% |
Demographics Similar to Immigrants from Northern Africa by Female Poverty
In terms of female poverty, the demographic groups most similar to Immigrants from Northern Africa are Immigrants from Bosnia and Herzegovina (13.2%, a difference of 0.10%), Hungarian (13.2%, a difference of 0.15%), Pennsylvania German (13.2%, a difference of 0.17%), Armenian (13.2%, a difference of 0.19%), and Immigrants from Fiji (13.2%, a difference of 0.25%).
| Demographics | Rating | Rank | Female Poverty |
| Tsimshian | 75.5 /100 | #150 | Good 13.1% |
| Immigrants | Germany | 74.9 /100 | #151 | Good 13.1% |
| Samoans | 73.6 /100 | #152 | Good 13.1% |
| Immigrants | Fiji | 71.0 /100 | #153 | Good 13.2% |
| Armenians | 70.4 /100 | #154 | Good 13.2% |
| Hungarians | 70.1 /100 | #155 | Good 13.2% |
| Immigrants | Bosnia and Herzegovina | 69.7 /100 | #156 | Good 13.2% |
| Immigrants | Northern Africa | 68.8 /100 | #157 | Good 13.2% |
| Pennsylvania Germans | 67.3 /100 | #158 | Good 13.2% |
| Costa Ricans | 63.6 /100 | #159 | Good 13.3% |
| Immigrants | Nepal | 62.7 /100 | #160 | Good 13.3% |
| Immigrants | Ethiopia | 62.5 /100 | #161 | Good 13.3% |
| Guamanians/Chamorros | 62.4 /100 | #162 | Good 13.3% |
| Immigrants | Albania | 62.4 /100 | #163 | Good 13.3% |
| Ethiopians | 62.3 /100 | #164 | Good 13.3% |