Navajo vs Hawaiian Seniors Poverty Over the Age of 65
COMPARE
Navajo
Hawaiian
Seniors Poverty Over the Age of 65
Seniors Poverty Over the Age of 65 Comparison
Navajo
Hawaiians
17.5%
SENIORS POVERTY OVER THE AGE OF 65
0.0/ 100
METRIC RATING
339th/ 347
METRIC RANK
10.3%
SENIORS POVERTY OVER THE AGE OF 65
93.9/ 100
METRIC RATING
107th/ 347
METRIC RANK
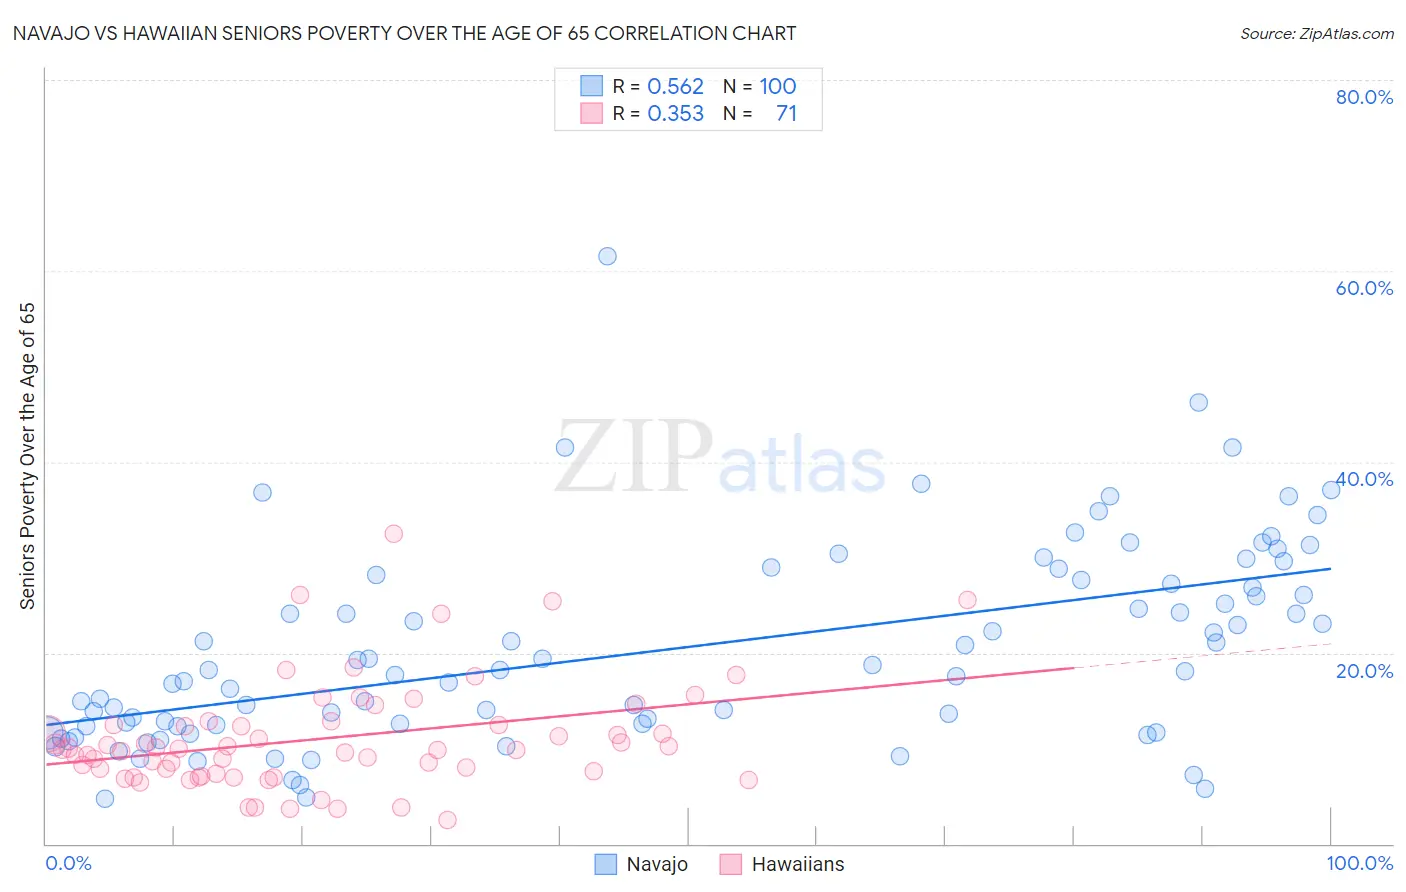
Navajo vs Hawaiian Seniors Poverty Over the Age of 65 Correlation Chart
The statistical analysis conducted on geographies consisting of 223,980,676 people shows a substantial positive correlation between the proportion of Navajo and poverty level among seniors over the age of 65 in the United States with a correlation coefficient (R) of 0.562 and weighted average of 17.5%. Similarly, the statistical analysis conducted on geographies consisting of 326,190,217 people shows a mild positive correlation between the proportion of Hawaiians and poverty level among seniors over the age of 65 in the United States with a correlation coefficient (R) of 0.353 and weighted average of 10.3%, a difference of 69.9%.
Seniors Poverty Over the Age of 65 Correlation Summary
| Measurement | Navajo | Hawaiian |
| Minimum | 4.8% | 2.5% |
| Maximum | 61.5% | 32.5% |
| Range | 56.8% | 30.1% |
| Mean | 20.3% | 11.0% |
| Median | 18.1% | 9.9% |
| Interquartile 25% (IQ1) | 12.3% | 7.4% |
| Interquartile 75% (IQ3) | 27.5% | 12.4% |
| Interquartile Range (IQR) | 15.1% | 5.0% |
| Standard Deviation (Sample) | 10.4% | 5.7% |
| Standard Deviation (Population) | 10.4% | 5.6% |
Similar Demographics by Seniors Poverty Over the Age of 65
Demographics Similar to Navajo by Seniors Poverty Over the Age of 65
In terms of seniors poverty over the age of 65, the demographic groups most similar to Navajo are Pueblo (17.2%, a difference of 1.5%), Hopi (17.8%, a difference of 1.9%), Dominican (17.8%, a difference of 2.3%), Immigrants from Cuba (17.9%, a difference of 2.8%), and Lumbee (18.1%, a difference of 3.9%).
| Demographics | Rating | Rank | Seniors Poverty Over the Age of 65 |
| Immigrants | Grenada | 0.0 /100 | #332 | Tragic 15.8% |
| Immigrants | Yemen | 0.0 /100 | #333 | Tragic 15.9% |
| Immigrants | Nicaragua | 0.0 /100 | #334 | Tragic 15.9% |
| Cubans | 0.0 /100 | #335 | Tragic 16.1% |
| Immigrants | Cabo Verde | 0.0 /100 | #336 | Tragic 16.2% |
| Immigrants | Caribbean | 0.0 /100 | #337 | Tragic 16.5% |
| Pueblo | 0.0 /100 | #338 | Tragic 17.2% |
| Navajo | 0.0 /100 | #339 | Tragic 17.5% |
| Hopi | 0.0 /100 | #340 | Tragic 17.8% |
| Dominicans | 0.0 /100 | #341 | Tragic 17.8% |
| Immigrants | Cuba | 0.0 /100 | #342 | Tragic 17.9% |
| Lumbee | 0.0 /100 | #343 | Tragic 18.1% |
| Immigrants | Dominican Republic | 0.0 /100 | #344 | Tragic 18.3% |
| Pima | 0.0 /100 | #345 | Tragic 19.8% |
| Tohono O'odham | 0.0 /100 | #346 | Tragic 20.8% |
Demographics Similar to Hawaiians by Seniors Poverty Over the Age of 65
In terms of seniors poverty over the age of 65, the demographic groups most similar to Hawaiians are Immigrants from Croatia (10.3%, a difference of 0.010%), Syrian (10.3%, a difference of 0.030%), Kenyan (10.3%, a difference of 0.070%), Aleut (10.3%, a difference of 0.090%), and South African (10.3%, a difference of 0.16%).
| Demographics | Rating | Rank | Seniors Poverty Over the Age of 65 |
| Marshallese | 95.3 /100 | #100 | Exceptional 10.2% |
| Immigrants | Jordan | 94.7 /100 | #101 | Exceptional 10.2% |
| Delaware | 94.5 /100 | #102 | Exceptional 10.2% |
| Icelanders | 94.4 /100 | #103 | Exceptional 10.3% |
| South Africans | 94.3 /100 | #104 | Exceptional 10.3% |
| Aleuts | 94.1 /100 | #105 | Exceptional 10.3% |
| Kenyans | 94.1 /100 | #106 | Exceptional 10.3% |
| Hawaiians | 93.9 /100 | #107 | Exceptional 10.3% |
| Immigrants | Croatia | 93.9 /100 | #108 | Exceptional 10.3% |
| Syrians | 93.8 /100 | #109 | Exceptional 10.3% |
| Immigrants | Zimbabwe | 93.5 /100 | #110 | Exceptional 10.3% |
| Immigrants | Belgium | 93.4 /100 | #111 | Exceptional 10.3% |
| Immigrants | Korea | 93.3 /100 | #112 | Exceptional 10.3% |
| Immigrants | Romania | 93.3 /100 | #113 | Exceptional 10.3% |
| Immigrants | Denmark | 92.7 /100 | #114 | Exceptional 10.3% |