Native/Alaskan vs Taiwanese Child Poverty Among Boys Under 16
COMPARE
Native/Alaskan
Taiwanese
Child Poverty Among Boys Under 16
Child Poverty Among Boys Under 16 Comparison
Natives/Alaskans
Taiwanese
24.0%
CHILD POVERTY AMONG BOYS UNDER 16
0.0/ 100
METRIC RATING
329th/ 347
METRIC RANK
14.8%
CHILD POVERTY AMONG BOYS UNDER 16
97.3/ 100
METRIC RATING
85th/ 347
METRIC RANK
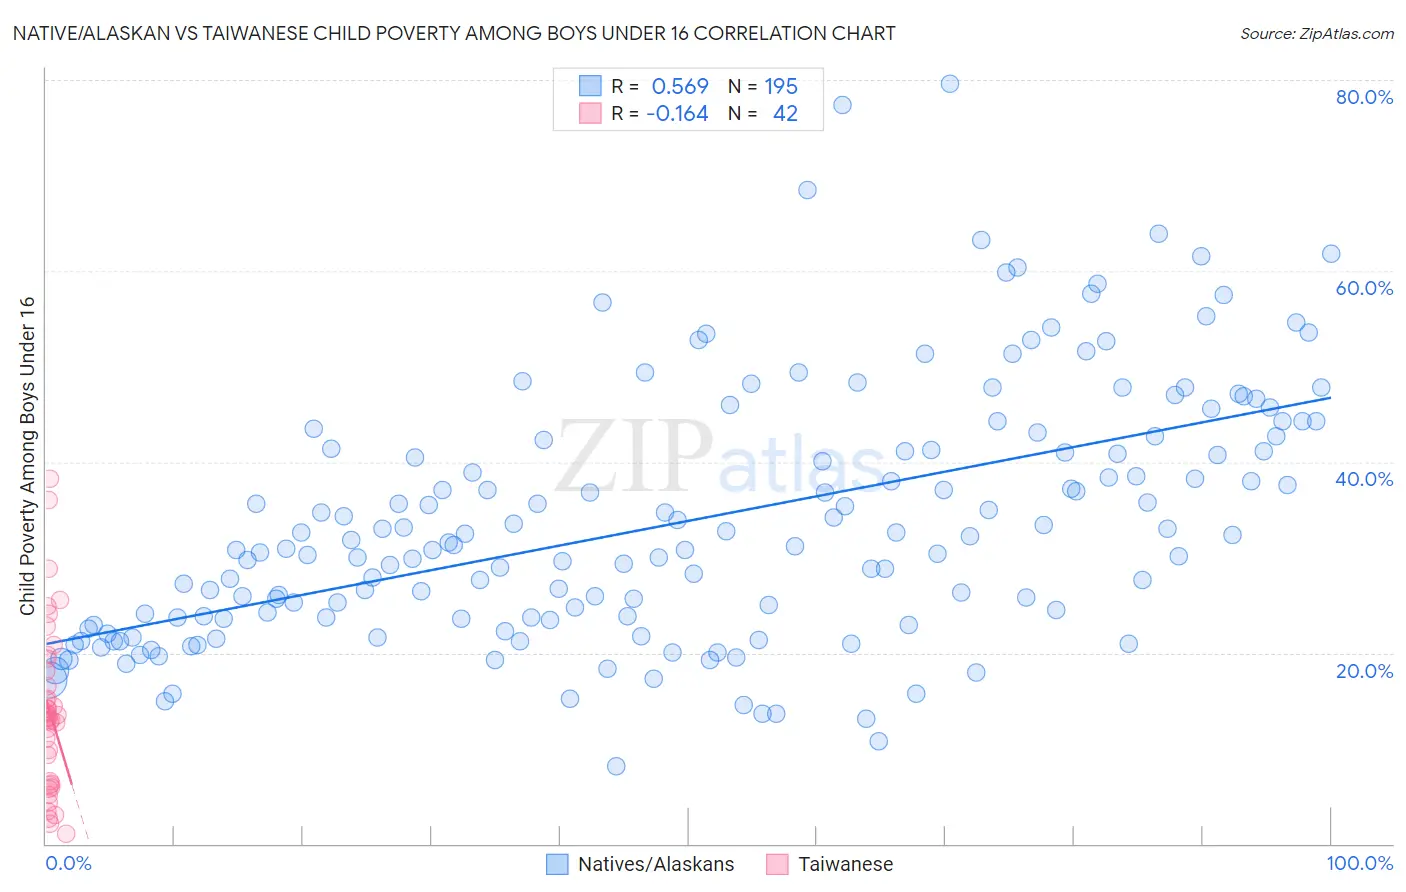
Native/Alaskan vs Taiwanese Child Poverty Among Boys Under 16 Correlation Chart
The statistical analysis conducted on geographies consisting of 502,623,262 people shows a substantial positive correlation between the proportion of Natives/Alaskans and poverty level among boys under the age of 16 in the United States with a correlation coefficient (R) of 0.569 and weighted average of 24.0%. Similarly, the statistical analysis conducted on geographies consisting of 31,649,664 people shows a poor negative correlation between the proportion of Taiwanese and poverty level among boys under the age of 16 in the United States with a correlation coefficient (R) of -0.164 and weighted average of 14.8%, a difference of 61.9%.
Child Poverty Among Boys Under 16 Correlation Summary
| Measurement | Native/Alaskan | Taiwanese |
| Minimum | 8.2% | 1.1% |
| Maximum | 79.6% | 38.2% |
| Range | 71.4% | 37.2% |
| Mean | 33.8% | 13.8% |
| Median | 31.3% | 13.2% |
| Interquartile 25% (IQ1) | 23.6% | 6.3% |
| Interquartile 75% (IQ3) | 42.3% | 18.1% |
| Interquartile Range (IQR) | 18.7% | 11.8% |
| Standard Deviation (Sample) | 13.3% | 8.7% |
| Standard Deviation (Population) | 13.2% | 8.5% |
Similar Demographics by Child Poverty Among Boys Under 16
Demographics Similar to Natives/Alaskans by Child Poverty Among Boys Under 16
In terms of child poverty among boys under 16, the demographic groups most similar to Natives/Alaskans are Colville (24.1%, a difference of 0.58%), Dominican (24.2%, a difference of 0.92%), Immigrants from Dominican Republic (24.3%, a difference of 1.5%), Pueblo (23.5%, a difference of 1.9%), and Apache (24.5%, a difference of 2.2%).
| Demographics | Rating | Rank | Child Poverty Among Boys Under 16 |
| Immigrants | Dominica | 0.0 /100 | #322 | Tragic 22.2% |
| Hondurans | 0.0 /100 | #323 | Tragic 22.3% |
| Immigrants | Congo | 0.0 /100 | #324 | Tragic 22.4% |
| Central American Indians | 0.0 /100 | #325 | Tragic 22.5% |
| Paiute | 0.0 /100 | #326 | Tragic 22.8% |
| Immigrants | Honduras | 0.0 /100 | #327 | Tragic 22.8% |
| Pueblo | 0.0 /100 | #328 | Tragic 23.5% |
| Natives/Alaskans | 0.0 /100 | #329 | Tragic 24.0% |
| Colville | 0.0 /100 | #330 | Tragic 24.1% |
| Dominicans | 0.0 /100 | #331 | Tragic 24.2% |
| Immigrants | Dominican Republic | 0.0 /100 | #332 | Tragic 24.3% |
| Apache | 0.0 /100 | #333 | Tragic 24.5% |
| Blacks/African Americans | 0.0 /100 | #334 | Tragic 24.5% |
| Yup'ik | 0.0 /100 | #335 | Tragic 24.7% |
| Sioux | 0.0 /100 | #336 | Tragic 25.3% |
Demographics Similar to Taiwanese by Child Poverty Among Boys Under 16
In terms of child poverty among boys under 16, the demographic groups most similar to Taiwanese are Swiss (14.8%, a difference of 0.040%), German (14.8%, a difference of 0.070%), Northern European (14.8%, a difference of 0.12%), Immigrants from North America (14.8%, a difference of 0.13%), and Immigrants from South Africa (14.8%, a difference of 0.16%).
| Demographics | Rating | Rank | Child Poverty Among Boys Under 16 |
| Egyptians | 97.8 /100 | #78 | Exceptional 14.7% |
| Immigrants | Eastern Europe | 97.8 /100 | #79 | Exceptional 14.7% |
| Immigrants | Russia | 97.7 /100 | #80 | Exceptional 14.7% |
| Immigrants | Canada | 97.6 /100 | #81 | Exceptional 14.7% |
| Ukrainians | 97.6 /100 | #82 | Exceptional 14.7% |
| Immigrants | South Africa | 97.4 /100 | #83 | Exceptional 14.8% |
| Swiss | 97.3 /100 | #84 | Exceptional 14.8% |
| Taiwanese | 97.3 /100 | #85 | Exceptional 14.8% |
| Germans | 97.2 /100 | #86 | Exceptional 14.8% |
| Northern Europeans | 97.2 /100 | #87 | Exceptional 14.8% |
| Immigrants | North America | 97.1 /100 | #88 | Exceptional 14.8% |
| Immigrants | Argentina | 97.1 /100 | #89 | Exceptional 14.8% |
| Austrians | 97.1 /100 | #90 | Exceptional 14.8% |
| Paraguayans | 96.8 /100 | #91 | Exceptional 14.9% |
| Argentineans | 96.7 /100 | #92 | Exceptional 14.9% |