Native/Alaskan vs Immigrants from Senegal Seniors Poverty Over the Age of 75
COMPARE
Native/Alaskan
Immigrants from Senegal
Seniors Poverty Over the Age of 75
Seniors Poverty Over the Age of 75 Comparison
Natives/Alaskans
Immigrants from Senegal
15.5%
SENIORS POVERTY OVER THE AGE OF 75
0.0/ 100
METRIC RATING
298th/ 347
METRIC RANK
14.8%
SENIORS POVERTY OVER THE AGE OF 75
0.0/ 100
METRIC RATING
282nd/ 347
METRIC RANK
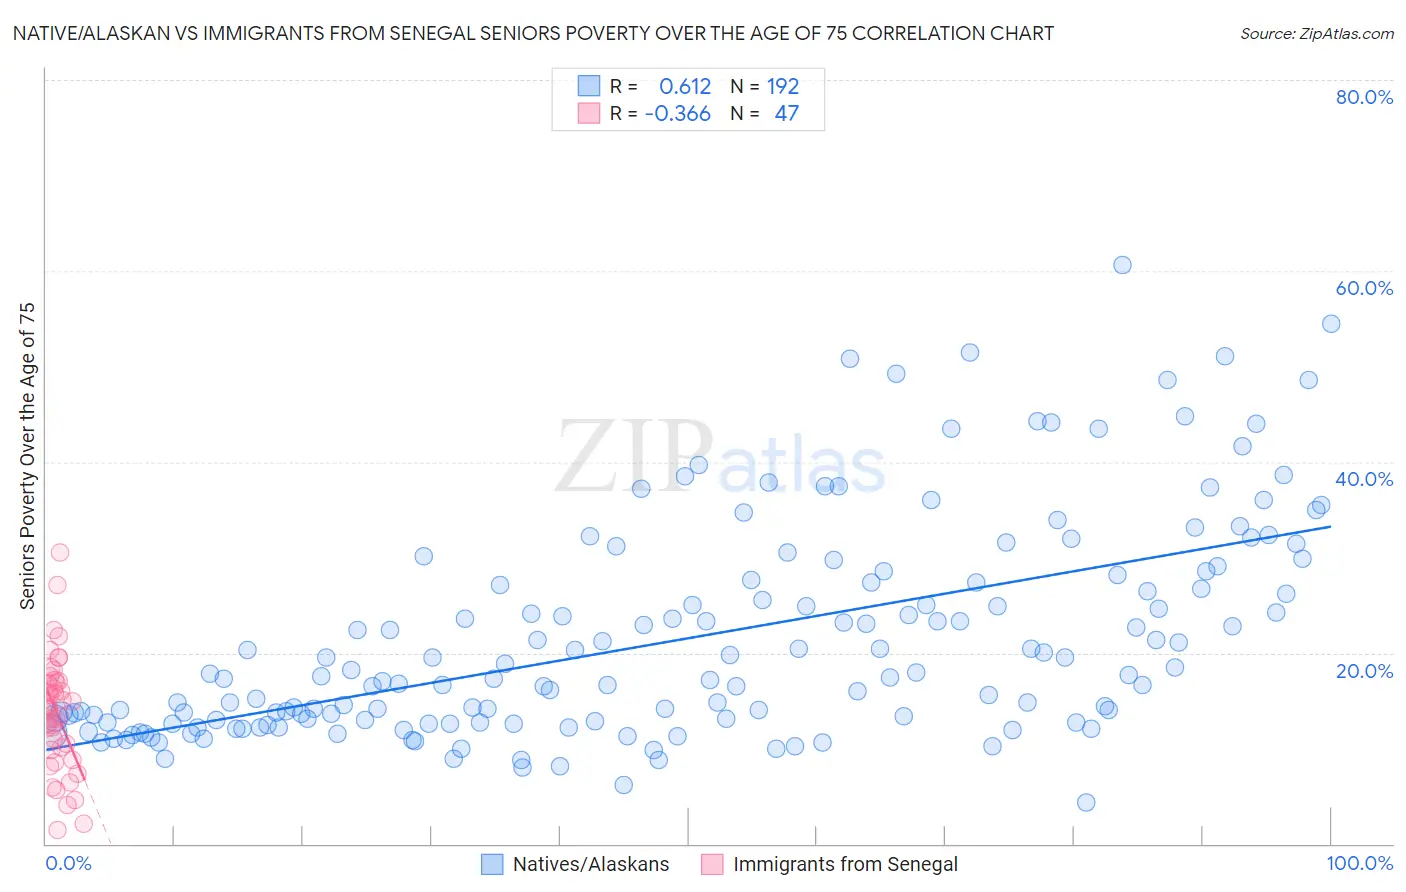
Native/Alaskan vs Immigrants from Senegal Seniors Poverty Over the Age of 75 Correlation Chart
The statistical analysis conducted on geographies consisting of 503,579,334 people shows a significant positive correlation between the proportion of Natives/Alaskans and poverty level among seniors over the age of 75 in the United States with a correlation coefficient (R) of 0.612 and weighted average of 15.5%. Similarly, the statistical analysis conducted on geographies consisting of 89,840,643 people shows a mild negative correlation between the proportion of Immigrants from Senegal and poverty level among seniors over the age of 75 in the United States with a correlation coefficient (R) of -0.366 and weighted average of 14.8%, a difference of 4.8%.
Seniors Poverty Over the Age of 75 Correlation Summary
| Measurement | Native/Alaskan | Immigrants from Senegal |
| Minimum | 4.3% | 1.5% |
| Maximum | 60.7% | 30.6% |
| Range | 56.3% | 29.1% |
| Mean | 21.4% | 13.7% |
| Median | 17.5% | 14.1% |
| Interquartile 25% (IQ1) | 12.8% | 9.8% |
| Interquartile 75% (IQ3) | 27.3% | 17.1% |
| Interquartile Range (IQR) | 14.6% | 7.2% |
| Standard Deviation (Sample) | 11.2% | 6.0% |
| Standard Deviation (Population) | 11.2% | 5.9% |
Demographics Similar to Natives/Alaskans and Immigrants from Senegal by Seniors Poverty Over the Age of 75
In terms of seniors poverty over the age of 75, the demographic groups most similar to Natives/Alaskans are Spanish American Indian (15.5%, a difference of 0.10%), Bahamian (15.5%, a difference of 0.11%), Honduran (15.4%, a difference of 0.34%), Yuman (15.4%, a difference of 0.62%), and U.S. Virgin Islander (15.4%, a difference of 0.80%). Similarly, the demographic groups most similar to Immigrants from Senegal are Guatemalan (14.8%, a difference of 0.060%), Belizean (14.8%, a difference of 0.18%), Central American (14.7%, a difference of 0.29%), Cheyenne (14.9%, a difference of 0.70%), and Immigrants from Mexico (14.9%, a difference of 0.89%).
| Demographics | Rating | Rank | Seniors Poverty Over the Age of 75 |
| Central Americans | 0.0 /100 | #280 | Tragic 14.7% |
| Belizeans | 0.0 /100 | #281 | Tragic 14.8% |
| Immigrants | Senegal | 0.0 /100 | #282 | Tragic 14.8% |
| Guatemalans | 0.0 /100 | #283 | Tragic 14.8% |
| Cheyenne | 0.0 /100 | #284 | Tragic 14.9% |
| Immigrants | Mexico | 0.0 /100 | #285 | Tragic 14.9% |
| Immigrants | Central America | 0.0 /100 | #286 | Tragic 15.0% |
| Immigrants | Guatemala | 0.0 /100 | #287 | Tragic 15.1% |
| Jamaicans | 0.0 /100 | #288 | Tragic 15.1% |
| Immigrants | Belize | 0.0 /100 | #289 | Tragic 15.2% |
| Immigrants | Azores | 0.0 /100 | #290 | Tragic 15.2% |
| Paiute | 0.0 /100 | #291 | Tragic 15.2% |
| Colville | 0.0 /100 | #292 | Tragic 15.2% |
| Apache | 0.0 /100 | #293 | Tragic 15.3% |
| Immigrants | Jamaica | 0.0 /100 | #294 | Tragic 15.3% |
| U.S. Virgin Islanders | 0.0 /100 | #295 | Tragic 15.4% |
| Yuman | 0.0 /100 | #296 | Tragic 15.4% |
| Hondurans | 0.0 /100 | #297 | Tragic 15.4% |
| Natives/Alaskans | 0.0 /100 | #298 | Tragic 15.5% |
| Spanish American Indians | 0.0 /100 | #299 | Tragic 15.5% |
| Bahamians | 0.0 /100 | #300 | Tragic 15.5% |