Native/Alaskan vs Immigrants from Lebanon Single Male Poverty
COMPARE
Native/Alaskan
Immigrants from Lebanon
Single Male Poverty
Single Male Poverty Comparison
Natives/Alaskans
Immigrants from Lebanon
19.6%
SINGLE MALE POVERTY
0.0/ 100
METRIC RATING
332nd/ 347
METRIC RANK
12.6%
SINGLE MALE POVERTY
75.0/ 100
METRIC RATING
145th/ 347
METRIC RANK
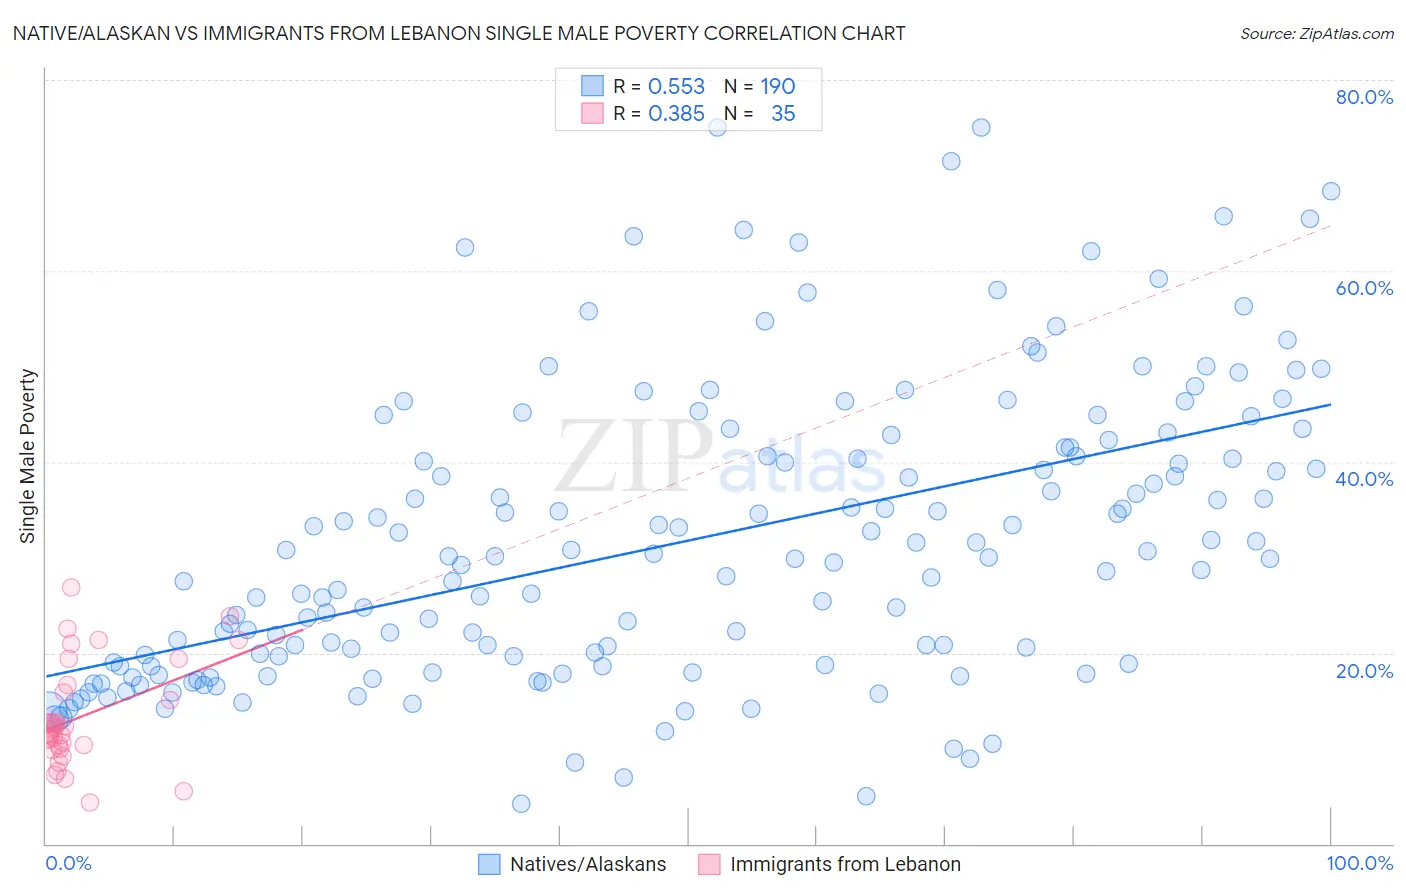
Native/Alaskan vs Immigrants from Lebanon Single Male Poverty Correlation Chart
The statistical analysis conducted on geographies consisting of 444,255,067 people shows a substantial positive correlation between the proportion of Natives/Alaskans and poverty level among single males in the United States with a correlation coefficient (R) of 0.553 and weighted average of 19.6%. Similarly, the statistical analysis conducted on geographies consisting of 197,960,009 people shows a mild positive correlation between the proportion of Immigrants from Lebanon and poverty level among single males in the United States with a correlation coefficient (R) of 0.385 and weighted average of 12.6%, a difference of 55.5%.
Single Male Poverty Correlation Summary
| Measurement | Native/Alaskan | Immigrants from Lebanon |
| Minimum | 4.3% | 4.3% |
| Maximum | 75.0% | 26.9% |
| Range | 70.7% | 22.5% |
| Mean | 31.7% | 13.3% |
| Median | 29.9% | 12.1% |
| Interquartile 25% (IQ1) | 18.7% | 10.0% |
| Interquartile 75% (IQ3) | 41.5% | 16.6% |
| Interquartile Range (IQR) | 22.8% | 6.7% |
| Standard Deviation (Sample) | 15.2% | 5.5% |
| Standard Deviation (Population) | 15.2% | 5.4% |
Similar Demographics by Single Male Poverty
Demographics Similar to Natives/Alaskans by Single Male Poverty
In terms of single male poverty, the demographic groups most similar to Natives/Alaskans are Paiute (19.3%, a difference of 1.7%), Inupiat (20.0%, a difference of 1.9%), Pima (20.2%, a difference of 2.7%), Cajun (19.1%, a difference of 2.8%), and Colville (18.4%, a difference of 6.4%).
| Demographics | Rating | Rank | Single Male Poverty |
| Choctaw | 0.0 /100 | #325 | Tragic 17.0% |
| Central American Indians | 0.0 /100 | #326 | Tragic 17.2% |
| Menominee | 0.0 /100 | #327 | Tragic 17.7% |
| Kiowa | 0.0 /100 | #328 | Tragic 18.3% |
| Colville | 0.0 /100 | #329 | Tragic 18.4% |
| Cajuns | 0.0 /100 | #330 | Tragic 19.1% |
| Paiute | 0.0 /100 | #331 | Tragic 19.3% |
| Natives/Alaskans | 0.0 /100 | #332 | Tragic 19.6% |
| Inupiat | 0.0 /100 | #333 | Tragic 20.0% |
| Pima | 0.0 /100 | #334 | Tragic 20.2% |
| Yuman | 0.0 /100 | #335 | Tragic 21.3% |
| Tohono O'odham | 0.0 /100 | #336 | Tragic 21.6% |
| Apache | 0.0 /100 | #337 | Tragic 21.6% |
| Pueblo | 0.0 /100 | #338 | Tragic 21.6% |
| Arapaho | 0.0 /100 | #339 | Tragic 21.9% |
Demographics Similar to Immigrants from Lebanon by Single Male Poverty
In terms of single male poverty, the demographic groups most similar to Immigrants from Lebanon are Native Hawaiian (12.6%, a difference of 0.0%), Hawaiian (12.6%, a difference of 0.010%), Malaysian (12.6%, a difference of 0.010%), Immigrants from France (12.6%, a difference of 0.060%), and Okinawan (12.6%, a difference of 0.070%).
| Demographics | Rating | Rank | Single Male Poverty |
| Immigrants | El Salvador | 80.0 /100 | #138 | Excellent 12.6% |
| Cubans | 79.9 /100 | #139 | Good 12.6% |
| Immigrants | Zimbabwe | 78.0 /100 | #140 | Good 12.6% |
| Okinawans | 75.9 /100 | #141 | Good 12.6% |
| Immigrants | Uganda | 75.9 /100 | #142 | Good 12.6% |
| Immigrants | France | 75.8 /100 | #143 | Good 12.6% |
| Hawaiians | 75.1 /100 | #144 | Good 12.6% |
| Immigrants | Lebanon | 75.0 /100 | #145 | Good 12.6% |
| Native Hawaiians | 75.0 /100 | #146 | Good 12.6% |
| Malaysians | 74.8 /100 | #147 | Good 12.6% |
| Yugoslavians | 73.9 /100 | #148 | Good 12.6% |
| Sierra Leoneans | 73.0 /100 | #149 | Good 12.6% |
| Immigrants | Panama | 72.1 /100 | #150 | Good 12.6% |
| Immigrants | Hungary | 71.9 /100 | #151 | Good 12.6% |
| Australians | 71.4 /100 | #152 | Good 12.6% |