Native/Alaskan vs Immigrants from Eritrea Single Father Poverty
COMPARE
Native/Alaskan
Immigrants from Eritrea
Single Father Poverty
Single Father Poverty Comparison
Natives/Alaskans
Immigrants from Eritrea
22.4%
SINGLE FATHER POVERTY
0.0/ 100
METRIC RATING
333rd/ 347
METRIC RANK
14.8%
SINGLE FATHER POVERTY
100.0/ 100
METRIC RATING
43rd/ 347
METRIC RANK
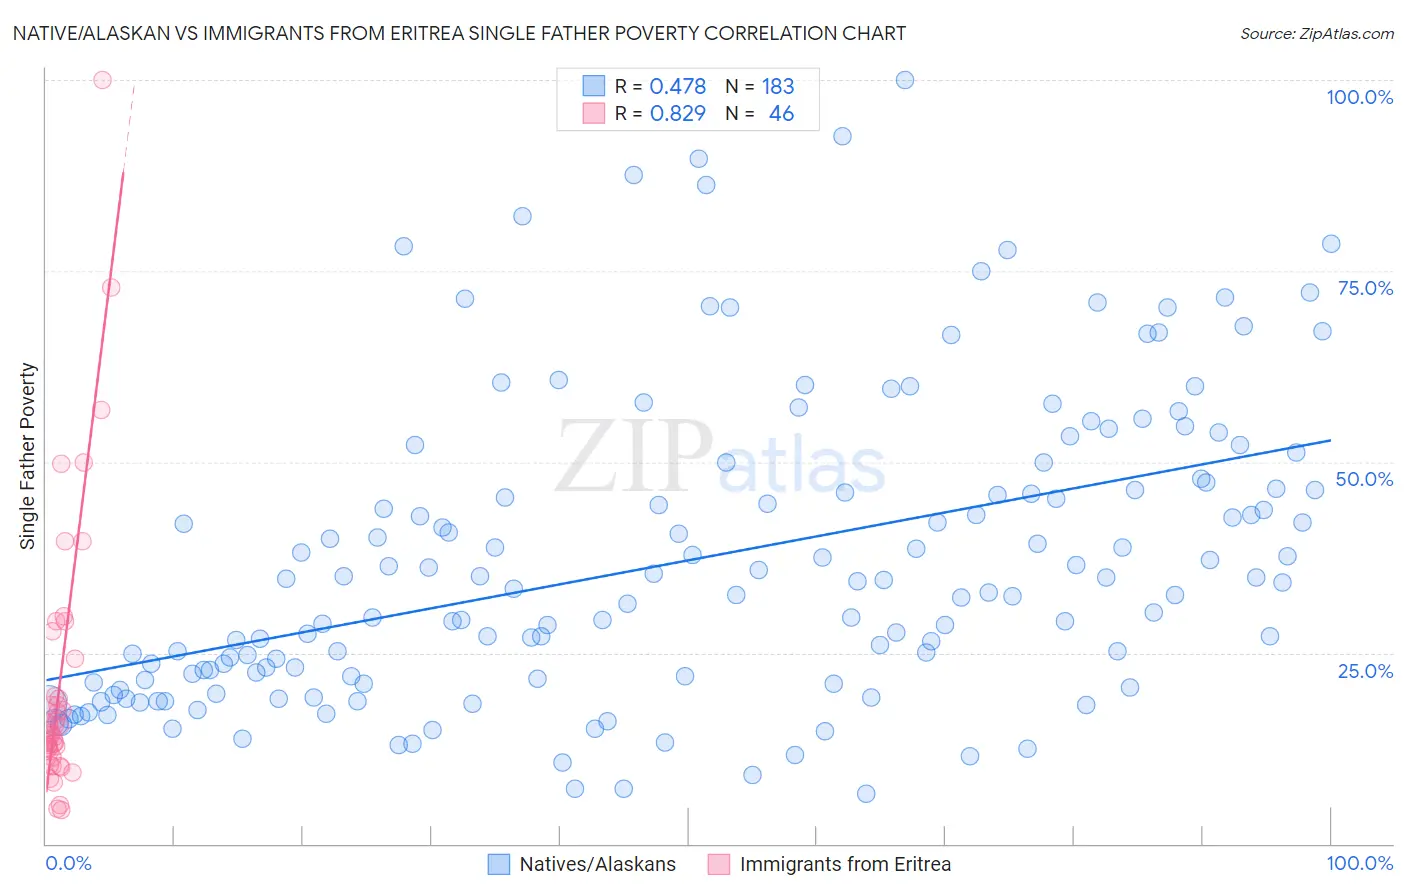
Native/Alaskan vs Immigrants from Eritrea Single Father Poverty Correlation Chart
The statistical analysis conducted on geographies consisting of 389,194,675 people shows a moderate positive correlation between the proportion of Natives/Alaskans and poverty level among single fathers in the United States with a correlation coefficient (R) of 0.478 and weighted average of 22.4%. Similarly, the statistical analysis conducted on geographies consisting of 96,659,601 people shows a very strong positive correlation between the proportion of Immigrants from Eritrea and poverty level among single fathers in the United States with a correlation coefficient (R) of 0.829 and weighted average of 14.8%, a difference of 51.3%.
Single Father Poverty Correlation Summary
| Measurement | Native/Alaskan | Immigrants from Eritrea |
| Minimum | 6.5% | 4.5% |
| Maximum | 100.0% | 100.0% |
| Range | 93.5% | 95.5% |
| Mean | 37.0% | 21.5% |
| Median | 33.3% | 15.0% |
| Interquartile 25% (IQ1) | 21.4% | 12.2% |
| Interquartile 75% (IQ3) | 46.5% | 24.2% |
| Interquartile Range (IQR) | 25.1% | 12.0% |
| Standard Deviation (Sample) | 19.7% | 18.6% |
| Standard Deviation (Population) | 19.7% | 18.4% |
Similar Demographics by Single Father Poverty
Demographics Similar to Natives/Alaskans by Single Father Poverty
In terms of single father poverty, the demographic groups most similar to Natives/Alaskans are Kiowa (22.5%, a difference of 0.36%), Tohono O'odham (22.0%, a difference of 1.7%), Shoshone (22.9%, a difference of 2.3%), Cajun (23.1%, a difference of 3.0%), and Central American Indian (21.7%, a difference of 3.3%).
| Demographics | Rating | Rank | Single Father Poverty |
| Immigrants | Yemen | 0.0 /100 | #326 | Tragic 20.6% |
| Choctaw | 0.0 /100 | #327 | Tragic 20.7% |
| Pueblo | 0.0 /100 | #328 | Tragic 21.1% |
| Colville | 0.0 /100 | #329 | Tragic 21.4% |
| Paiute | 0.0 /100 | #330 | Tragic 21.6% |
| Central American Indians | 0.0 /100 | #331 | Tragic 21.7% |
| Tohono O'odham | 0.0 /100 | #332 | Tragic 22.0% |
| Natives/Alaskans | 0.0 /100 | #333 | Tragic 22.4% |
| Kiowa | 0.0 /100 | #334 | Tragic 22.5% |
| Shoshone | 0.0 /100 | #335 | Tragic 22.9% |
| Cajuns | 0.0 /100 | #336 | Tragic 23.1% |
| Sioux | 0.0 /100 | #337 | Tragic 23.9% |
| Arapaho | 0.0 /100 | #338 | Tragic 24.0% |
| Apache | 0.0 /100 | #339 | Tragic 24.2% |
| Houma | 0.0 /100 | #340 | Tragic 26.7% |
Demographics Similar to Immigrants from Eritrea by Single Father Poverty
In terms of single father poverty, the demographic groups most similar to Immigrants from Eritrea are Indian (Asian) (14.8%, a difference of 0.040%), Immigrants from Nepal (14.8%, a difference of 0.040%), Pima (14.8%, a difference of 0.21%), Immigrants from Asia (14.7%, a difference of 0.41%), and Bolivian (14.7%, a difference of 0.59%).
| Demographics | Rating | Rank | Single Father Poverty |
| Immigrants | Indonesia | 100.0 /100 | #36 | Exceptional 14.7% |
| Immigrants | Eastern Africa | 100.0 /100 | #37 | Exceptional 14.7% |
| Bolivians | 100.0 /100 | #38 | Exceptional 14.7% |
| Immigrants | Asia | 100.0 /100 | #39 | Exceptional 14.7% |
| Pima | 100.0 /100 | #40 | Exceptional 14.8% |
| Indians (Asian) | 100.0 /100 | #41 | Exceptional 14.8% |
| Immigrants | Nepal | 100.0 /100 | #42 | Exceptional 14.8% |
| Immigrants | Eritrea | 100.0 /100 | #43 | Exceptional 14.8% |
| Salvadorans | 100.0 /100 | #44 | Exceptional 14.9% |
| Immigrants | Somalia | 100.0 /100 | #45 | Exceptional 14.9% |
| Immigrants | Cambodia | 99.9 /100 | #46 | Exceptional 14.9% |
| Immigrants | China | 99.9 /100 | #47 | Exceptional 14.9% |
| Malaysians | 99.9 /100 | #48 | Exceptional 14.9% |
| Immigrants | Eastern Asia | 99.9 /100 | #49 | Exceptional 15.0% |
| Bhutanese | 99.9 /100 | #50 | Exceptional 15.0% |