Native/Alaskan vs Comanche Family Poverty
COMPARE
Native/Alaskan
Comanche
Family Poverty
Family Poverty Comparison
Natives/Alaskans
Comanche
14.3%
FAMILY POVERTY
0.0/ 100
METRIC RATING
330th/ 347
METRIC RANK
11.0%
FAMILY POVERTY
0.1/ 100
METRIC RATING
267th/ 347
METRIC RANK
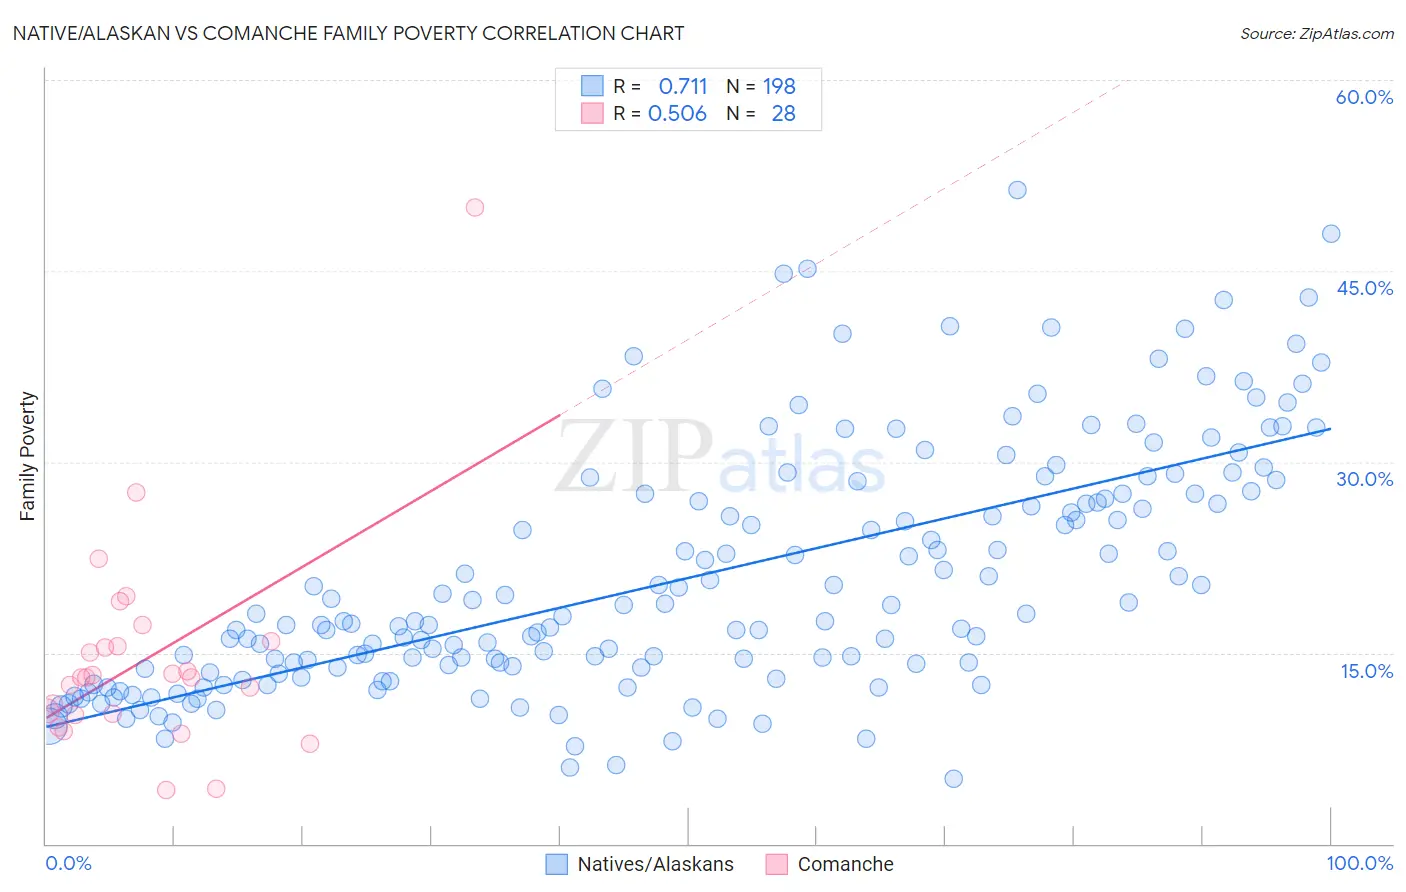
Native/Alaskan vs Comanche Family Poverty Correlation Chart
The statistical analysis conducted on geographies consisting of 511,183,066 people shows a strong positive correlation between the proportion of Natives/Alaskans and poverty level among families in the United States with a correlation coefficient (R) of 0.711 and weighted average of 14.3%. Similarly, the statistical analysis conducted on geographies consisting of 109,722,823 people shows a substantial positive correlation between the proportion of Comanche and poverty level among families in the United States with a correlation coefficient (R) of 0.506 and weighted average of 11.0%, a difference of 29.1%.
Family Poverty Correlation Summary
| Measurement | Native/Alaskan | Comanche |
| Minimum | 5.1% | 4.3% |
| Maximum | 51.4% | 50.0% |
| Range | 46.3% | 45.7% |
| Mean | 20.9% | 14.5% |
| Median | 17.5% | 13.1% |
| Interquartile 25% (IQ1) | 13.7% | 10.2% |
| Interquartile 75% (IQ3) | 27.5% | 15.7% |
| Interquartile Range (IQR) | 13.8% | 5.5% |
| Standard Deviation (Sample) | 9.6% | 8.6% |
| Standard Deviation (Population) | 9.6% | 8.4% |
Similar Demographics by Family Poverty
Demographics Similar to Natives/Alaskans by Family Poverty
In terms of family poverty, the demographic groups most similar to Natives/Alaskans are Cheyenne (14.3%, a difference of 0.14%), Dominican (14.3%, a difference of 0.58%), Immigrants from Dominican Republic (14.4%, a difference of 1.2%), Houma (14.6%, a difference of 2.5%), and Apache (14.7%, a difference of 3.4%).
| Demographics | Rating | Rank | Family Poverty |
| Menominee | 0.0 /100 | #323 | Tragic 12.7% |
| Immigrants | Dominica | 0.0 /100 | #324 | Tragic 12.7% |
| Paiute | 0.0 /100 | #325 | Tragic 13.0% |
| Colville | 0.0 /100 | #326 | Tragic 13.0% |
| Yakama | 0.0 /100 | #327 | Tragic 13.1% |
| Central American Indians | 0.0 /100 | #328 | Tragic 13.3% |
| Blacks/African Americans | 0.0 /100 | #329 | Tragic 13.3% |
| Natives/Alaskans | 0.0 /100 | #330 | Tragic 14.3% |
| Cheyenne | 0.0 /100 | #331 | Tragic 14.3% |
| Dominicans | 0.0 /100 | #332 | Tragic 14.3% |
| Immigrants | Dominican Republic | 0.0 /100 | #333 | Tragic 14.4% |
| Houma | 0.0 /100 | #334 | Tragic 14.6% |
| Apache | 0.0 /100 | #335 | Tragic 14.7% |
| Sioux | 0.0 /100 | #336 | Tragic 15.9% |
| Hopi | 0.0 /100 | #337 | Tragic 15.9% |
Demographics Similar to Comanche by Family Poverty
In terms of family poverty, the demographic groups most similar to Comanche are Immigrants from El Salvador (11.0%, a difference of 0.010%), Jamaican (11.1%, a difference of 0.10%), Immigrants from Ecuador (11.1%, a difference of 0.58%), Immigrants from Nicaragua (11.1%, a difference of 0.59%), and Immigrants from Bahamas (11.1%, a difference of 0.84%).
| Demographics | Rating | Rank | Family Poverty |
| Bangladeshis | 0.2 /100 | #260 | Tragic 10.9% |
| Shoshone | 0.2 /100 | #261 | Tragic 10.9% |
| Spanish American Indians | 0.2 /100 | #262 | Tragic 10.9% |
| Cape Verdeans | 0.1 /100 | #263 | Tragic 10.9% |
| Trinidadians and Tobagonians | 0.1 /100 | #264 | Tragic 10.9% |
| Immigrants | Trinidad and Tobago | 0.1 /100 | #265 | Tragic 10.9% |
| Immigrants | El Salvador | 0.1 /100 | #266 | Tragic 11.0% |
| Comanche | 0.1 /100 | #267 | Tragic 11.0% |
| Jamaicans | 0.1 /100 | #268 | Tragic 11.1% |
| Immigrants | Ecuador | 0.1 /100 | #269 | Tragic 11.1% |
| Immigrants | Nicaragua | 0.1 /100 | #270 | Tragic 11.1% |
| Immigrants | Bahamas | 0.1 /100 | #271 | Tragic 11.1% |
| Immigrants | Jamaica | 0.1 /100 | #272 | Tragic 11.2% |
| Somalis | 0.1 /100 | #273 | Tragic 11.2% |
| Spanish Americans | 0.1 /100 | #274 | Tragic 11.2% |