Native Hawaiian vs Immigrants from Nigeria Single Father Poverty
COMPARE
Native Hawaiian
Immigrants from Nigeria
Single Father Poverty
Single Father Poverty Comparison
Native Hawaiians
Immigrants from Nigeria
15.7%
SINGLE FATHER POVERTY
95.8/ 100
METRIC RATING
107th/ 347
METRIC RANK
15.9%
SINGLE FATHER POVERTY
90.8/ 100
METRIC RATING
128th/ 347
METRIC RANK
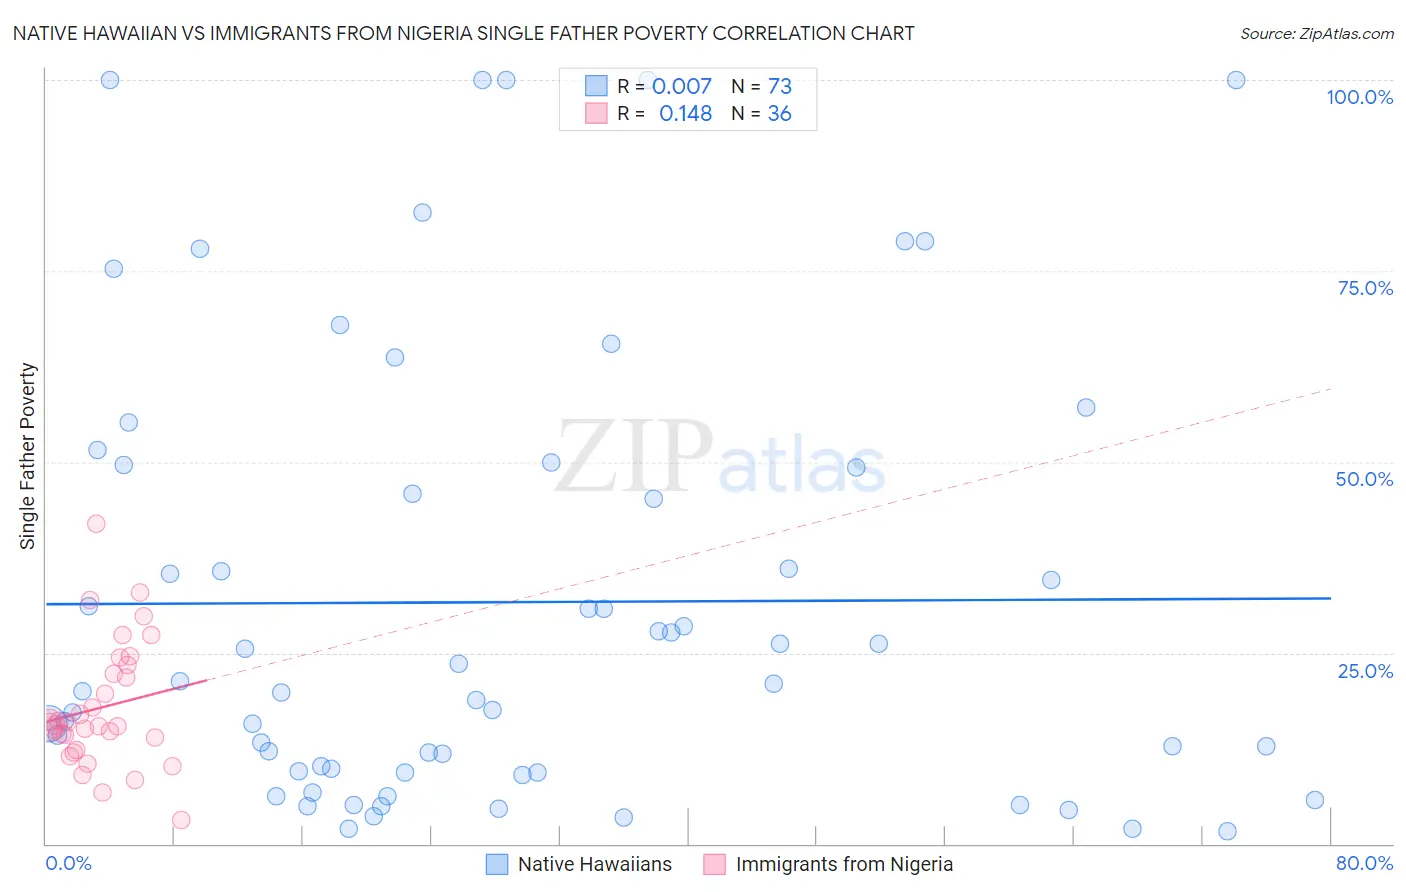
Native Hawaiian vs Immigrants from Nigeria Single Father Poverty Correlation Chart
The statistical analysis conducted on geographies consisting of 273,491,221 people shows no correlation between the proportion of Native Hawaiians and poverty level among single fathers in the United States with a correlation coefficient (R) of 0.007 and weighted average of 15.7%. Similarly, the statistical analysis conducted on geographies consisting of 237,669,911 people shows a poor positive correlation between the proportion of Immigrants from Nigeria and poverty level among single fathers in the United States with a correlation coefficient (R) of 0.148 and weighted average of 15.9%, a difference of 0.95%.
Single Father Poverty Correlation Summary
| Measurement | Native Hawaiian | Immigrants from Nigeria |
| Minimum | 1.7% | 3.1% |
| Maximum | 100.0% | 41.8% |
| Range | 98.3% | 38.7% |
| Mean | 31.6% | 17.8% |
| Median | 20.9% | 15.4% |
| Interquartile 25% (IQ1) | 9.4% | 13.1% |
| Interquartile 75% (IQ3) | 49.4% | 22.8% |
| Interquartile Range (IQR) | 40.0% | 9.7% |
| Standard Deviation (Sample) | 28.8% | 8.1% |
| Standard Deviation (Population) | 28.6% | 8.0% |
Similar Demographics by Single Father Poverty
Demographics Similar to Native Hawaiians by Single Father Poverty
In terms of single father poverty, the demographic groups most similar to Native Hawaiians are Pakistani (15.7%, a difference of 0.010%), Immigrants from Poland (15.7%, a difference of 0.020%), Immigrants from Australia (15.7%, a difference of 0.090%), Australian (15.7%, a difference of 0.10%), and South American Indian (15.7%, a difference of 0.12%).
| Demographics | Rating | Rank | Single Father Poverty |
| Immigrants | Chile | 96.9 /100 | #100 | Exceptional 15.7% |
| Fijians | 96.8 /100 | #101 | Exceptional 15.7% |
| Chileans | 96.4 /100 | #102 | Exceptional 15.7% |
| South American Indians | 96.2 /100 | #103 | Exceptional 15.7% |
| Australians | 96.1 /100 | #104 | Exceptional 15.7% |
| Immigrants | Australia | 96.1 /100 | #105 | Exceptional 15.7% |
| Immigrants | Poland | 95.8 /100 | #106 | Exceptional 15.7% |
| Native Hawaiians | 95.8 /100 | #107 | Exceptional 15.7% |
| Pakistanis | 95.7 /100 | #108 | Exceptional 15.7% |
| Turks | 95.1 /100 | #109 | Exceptional 15.8% |
| Immigrants | Africa | 95.1 /100 | #110 | Exceptional 15.8% |
| Bulgarians | 94.8 /100 | #111 | Exceptional 15.8% |
| Immigrants | Latvia | 94.7 /100 | #112 | Exceptional 15.8% |
| Danes | 94.5 /100 | #113 | Exceptional 15.8% |
| Argentineans | 94.4 /100 | #114 | Exceptional 15.8% |
Demographics Similar to Immigrants from Nigeria by Single Father Poverty
In terms of single father poverty, the demographic groups most similar to Immigrants from Nigeria are Immigrants from West Indies (15.9%, a difference of 0.0%), Immigrants from Liberia (15.9%, a difference of 0.030%), Hmong (15.9%, a difference of 0.040%), Iraqi (15.9%, a difference of 0.050%), and Immigrants from Panama (15.9%, a difference of 0.060%).
| Demographics | Rating | Rank | Single Father Poverty |
| Immigrants | Immigrants | 91.9 /100 | #121 | Exceptional 15.9% |
| Sudanese | 91.6 /100 | #122 | Exceptional 15.9% |
| Palestinians | 91.3 /100 | #123 | Exceptional 15.9% |
| Immigrants | Panama | 91.3 /100 | #124 | Exceptional 15.9% |
| Iraqis | 91.2 /100 | #125 | Exceptional 15.9% |
| Hmong | 91.1 /100 | #126 | Exceptional 15.9% |
| Immigrants | Liberia | 91.1 /100 | #127 | Exceptional 15.9% |
| Immigrants | Nigeria | 90.8 /100 | #128 | Exceptional 15.9% |
| Immigrants | West Indies | 90.8 /100 | #129 | Exceptional 15.9% |
| Norwegians | 90.2 /100 | #130 | Exceptional 15.9% |
| Nicaraguans | 90.1 /100 | #131 | Exceptional 15.9% |
| Immigrants | Portugal | 89.7 /100 | #132 | Excellent 15.9% |
| Immigrants | Syria | 89.5 /100 | #133 | Excellent 15.9% |
| Immigrants | South America | 88.5 /100 | #134 | Excellent 15.9% |
| Immigrants | Sri Lanka | 88.2 /100 | #135 | Excellent 15.9% |