Native Hawaiian vs Immigrants Family Poverty
COMPARE
Native Hawaiian
Immigrants
Family Poverty
Family Poverty Comparison
Native Hawaiians
Immigrants
8.3%
FAMILY POVERTY
91.3/ 100
METRIC RATING
121st/ 347
METRIC RANK
10.0%
FAMILY POVERTY
3.6/ 100
METRIC RATING
225th/ 347
METRIC RANK
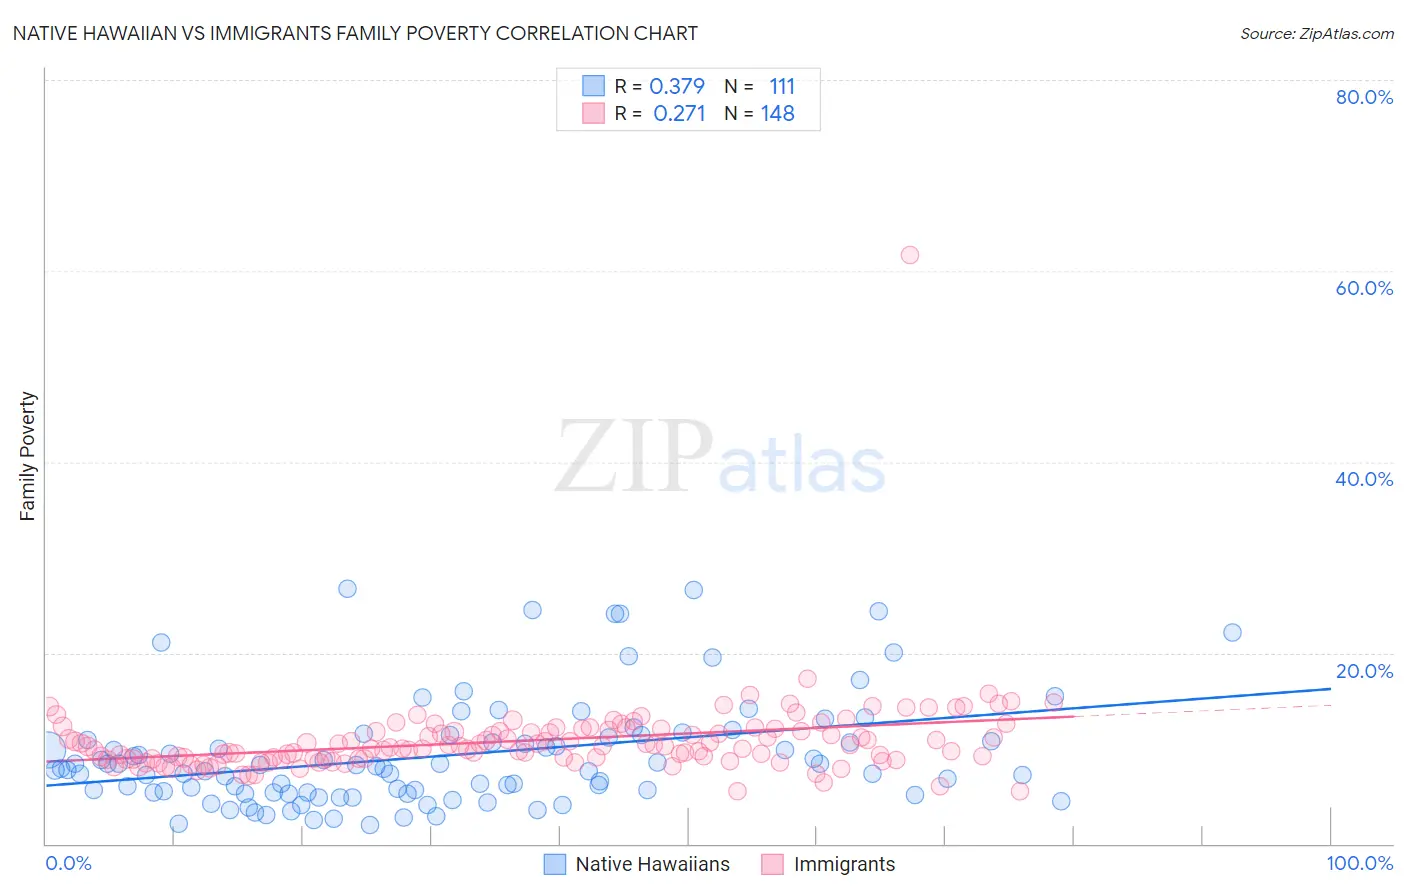
Native Hawaiian vs Immigrants Family Poverty Correlation Chart
The statistical analysis conducted on geographies consisting of 331,480,181 people shows a mild positive correlation between the proportion of Native Hawaiians and poverty level among families in the United States with a correlation coefficient (R) of 0.379 and weighted average of 8.3%. Similarly, the statistical analysis conducted on geographies consisting of 572,663,107 people shows a weak positive correlation between the proportion of Immigrants and poverty level among families in the United States with a correlation coefficient (R) of 0.271 and weighted average of 10.0%, a difference of 19.9%.
Family Poverty Correlation Summary
| Measurement | Native Hawaiian | Immigrants |
| Minimum | 1.9% | 5.5% |
| Maximum | 26.8% | 61.7% |
| Range | 24.8% | 56.2% |
| Mean | 9.3% | 10.8% |
| Median | 7.9% | 10.2% |
| Interquartile 25% (IQ1) | 5.3% | 8.9% |
| Interquartile 75% (IQ3) | 11.1% | 11.9% |
| Interquartile Range (IQR) | 5.8% | 3.0% |
| Standard Deviation (Sample) | 5.7% | 4.7% |
| Standard Deviation (Population) | 5.6% | 4.7% |
Similar Demographics by Family Poverty
Demographics Similar to Native Hawaiians by Family Poverty
In terms of family poverty, the demographic groups most similar to Native Hawaiians are Paraguayan (8.3%, a difference of 0.010%), Palestinian (8.3%, a difference of 0.080%), Immigrants from Egypt (8.3%, a difference of 0.17%), Soviet Union (8.3%, a difference of 0.18%), and Pakistani (8.3%, a difference of 0.22%).
| Demographics | Rating | Rank | Family Poverty |
| Immigrants | Zimbabwe | 94.0 /100 | #114 | Exceptional 8.2% |
| Immigrants | Israel | 93.5 /100 | #115 | Exceptional 8.2% |
| South Africans | 93.4 /100 | #116 | Exceptional 8.2% |
| Immigrants | Russia | 93.2 /100 | #117 | Exceptional 8.2% |
| Immigrants | Western Europe | 92.9 /100 | #118 | Exceptional 8.2% |
| French | 92.8 /100 | #119 | Exceptional 8.3% |
| Immigrants | Egypt | 91.6 /100 | #120 | Exceptional 8.3% |
| Native Hawaiians | 91.3 /100 | #121 | Exceptional 8.3% |
| Paraguayans | 91.2 /100 | #122 | Exceptional 8.3% |
| Palestinians | 91.1 /100 | #123 | Exceptional 8.3% |
| Soviet Union | 90.8 /100 | #124 | Exceptional 8.3% |
| Pakistanis | 90.8 /100 | #125 | Exceptional 8.3% |
| Icelanders | 90.3 /100 | #126 | Exceptional 8.3% |
| Immigrants | Hungary | 89.9 /100 | #127 | Excellent 8.4% |
| Argentineans | 89.6 /100 | #128 | Excellent 8.4% |
Demographics Similar to Immigrants by Family Poverty
In terms of family poverty, the demographic groups most similar to Immigrants are Marshallese (9.9%, a difference of 0.25%), Ottawa (10.0%, a difference of 0.27%), Immigrants from Armenia (10.0%, a difference of 0.29%), Sudanese (10.0%, a difference of 0.49%), and Immigrants from Uzbekistan (10.0%, a difference of 0.51%).
| Demographics | Rating | Rank | Family Poverty |
| Panamanians | 5.6 /100 | #218 | Tragic 9.8% |
| Immigrants | Eritrea | 5.4 /100 | #219 | Tragic 9.9% |
| Bermudans | 5.3 /100 | #220 | Tragic 9.9% |
| Immigrants | Cambodia | 4.8 /100 | #221 | Tragic 9.9% |
| Japanese | 4.8 /100 | #222 | Tragic 9.9% |
| Immigrants | Africa | 4.3 /100 | #223 | Tragic 9.9% |
| Marshallese | 3.9 /100 | #224 | Tragic 9.9% |
| Immigrants | Immigrants | 3.6 /100 | #225 | Tragic 10.0% |
| Ottawa | 3.3 /100 | #226 | Tragic 10.0% |
| Immigrants | Armenia | 3.3 /100 | #227 | Tragic 10.0% |
| Sudanese | 3.1 /100 | #228 | Tragic 10.0% |
| Immigrants | Uzbekistan | 3.1 /100 | #229 | Tragic 10.0% |
| Immigrants | Panama | 3.1 /100 | #230 | Tragic 10.0% |
| Alaskan Athabascans | 2.7 /100 | #231 | Tragic 10.1% |
| Immigrants | Sudan | 2.3 /100 | #232 | Tragic 10.1% |