Moroccan vs Immigrants from Romania Single Father Poverty
COMPARE
Moroccan
Immigrants from Romania
Single Father Poverty
Single Father Poverty Comparison
Moroccans
Immigrants from Romania
17.0%
SINGLE FATHER POVERTY
2.1/ 100
METRIC RATING
242nd/ 347
METRIC RANK
15.5%
SINGLE FATHER POVERTY
98.6/ 100
METRIC RATING
91st/ 347
METRIC RANK
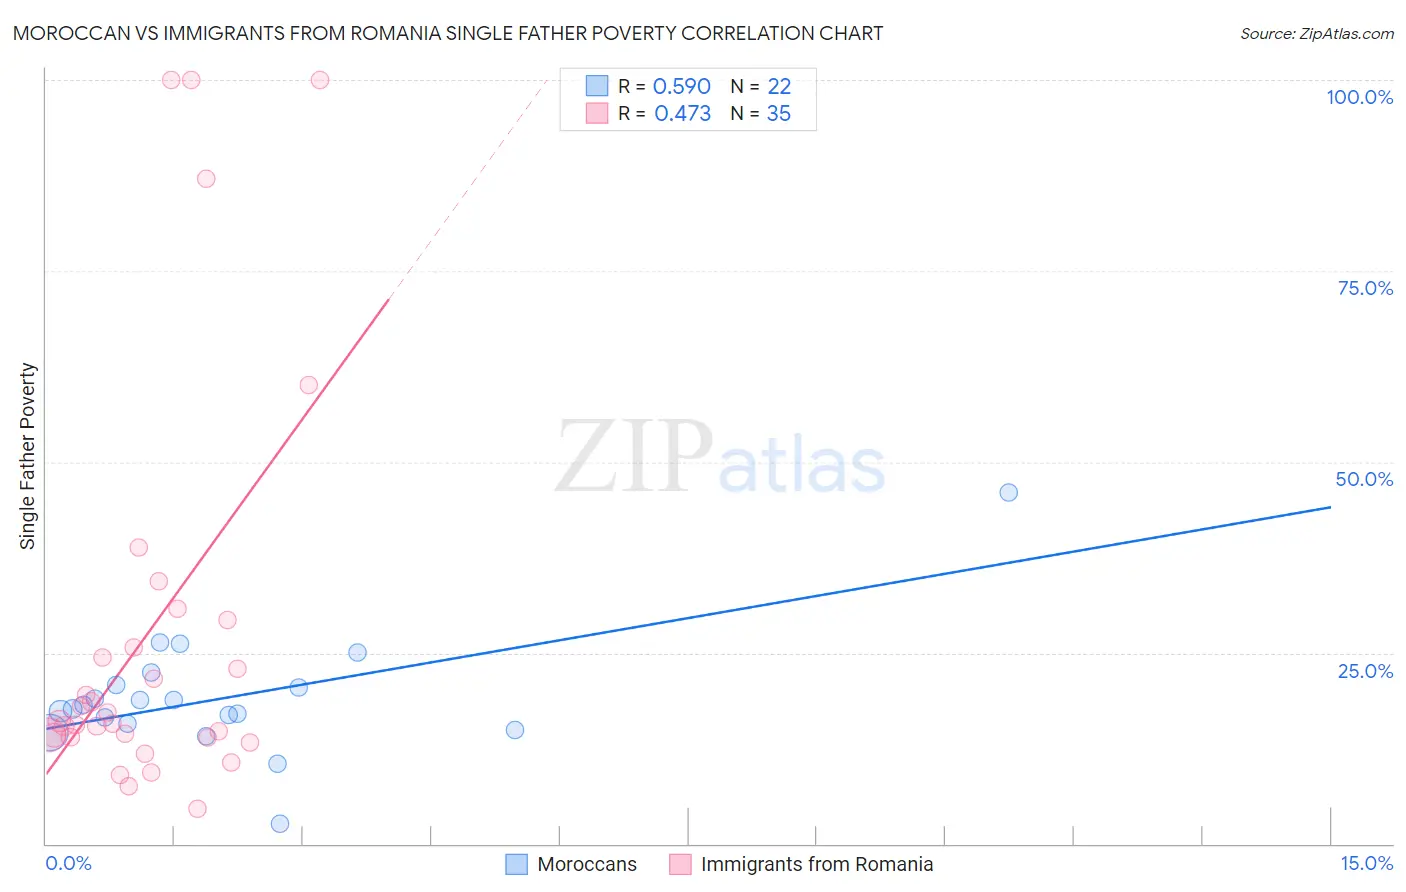
Moroccan vs Immigrants from Romania Single Father Poverty Correlation Chart
The statistical analysis conducted on geographies consisting of 173,540,722 people shows a substantial positive correlation between the proportion of Moroccans and poverty level among single fathers in the United States with a correlation coefficient (R) of 0.590 and weighted average of 17.0%. Similarly, the statistical analysis conducted on geographies consisting of 209,903,487 people shows a moderate positive correlation between the proportion of Immigrants from Romania and poverty level among single fathers in the United States with a correlation coefficient (R) of 0.473 and weighted average of 15.5%, a difference of 9.4%.
Single Father Poverty Correlation Summary
| Measurement | Moroccan | Immigrants from Romania |
| Minimum | 2.6% | 4.5% |
| Maximum | 46.0% | 100.0% |
| Range | 43.4% | 95.5% |
| Mean | 19.1% | 27.9% |
| Median | 17.9% | 16.0% |
| Interquartile 25% (IQ1) | 15.7% | 13.9% |
| Interquartile 75% (IQ3) | 20.7% | 29.3% |
| Interquartile Range (IQR) | 5.0% | 15.3% |
| Standard Deviation (Sample) | 7.9% | 27.1% |
| Standard Deviation (Population) | 7.7% | 26.8% |
Similar Demographics by Single Father Poverty
Demographics Similar to Moroccans by Single Father Poverty
In terms of single father poverty, the demographic groups most similar to Moroccans are Czech (17.0%, a difference of 0.10%), Finnish (16.9%, a difference of 0.22%), Bermudan (16.9%, a difference of 0.23%), Immigrants from Saudi Arabia (16.9%, a difference of 0.25%), and Subsaharan African (16.9%, a difference of 0.32%).
| Demographics | Rating | Rank | Single Father Poverty |
| Immigrants | Western Europe | 2.9 /100 | #235 | Tragic 16.9% |
| Immigrants | Germany | 2.9 /100 | #236 | Tragic 16.9% |
| Sub-Saharan Africans | 2.9 /100 | #237 | Tragic 16.9% |
| Immigrants | Saudi Arabia | 2.7 /100 | #238 | Tragic 16.9% |
| Bermudans | 2.6 /100 | #239 | Tragic 16.9% |
| Finns | 2.6 /100 | #240 | Tragic 16.9% |
| Czechs | 2.3 /100 | #241 | Tragic 17.0% |
| Moroccans | 2.1 /100 | #242 | Tragic 17.0% |
| Immigrants | Cabo Verde | 1.6 /100 | #243 | Tragic 17.0% |
| Hondurans | 1.6 /100 | #244 | Tragic 17.0% |
| Trinidadians and Tobagonians | 1.5 /100 | #245 | Tragic 17.0% |
| Immigrants | Ireland | 1.4 /100 | #246 | Tragic 17.1% |
| Greeks | 1.3 /100 | #247 | Tragic 17.1% |
| Czechoslovakians | 1.3 /100 | #248 | Tragic 17.1% |
| Canadians | 1.3 /100 | #249 | Tragic 17.1% |
Demographics Similar to Immigrants from Romania by Single Father Poverty
In terms of single father poverty, the demographic groups most similar to Immigrants from Romania are Mexican American Indian (15.5%, a difference of 0.10%), Immigrants from Serbia (15.5%, a difference of 0.11%), Basque (15.5%, a difference of 0.15%), Immigrants from Uruguay (15.6%, a difference of 0.29%), and Immigrants from Korea (15.5%, a difference of 0.34%).
| Demographics | Rating | Rank | Single Father Poverty |
| Peruvians | 99.2 /100 | #84 | Exceptional 15.4% |
| Immigrants | Oceania | 99.1 /100 | #85 | Exceptional 15.4% |
| Immigrants | Russia | 99.0 /100 | #86 | Exceptional 15.5% |
| Brazilians | 99.0 /100 | #87 | Exceptional 15.5% |
| Burmese | 99.0 /100 | #88 | Exceptional 15.5% |
| Immigrants | Korea | 99.0 /100 | #89 | Exceptional 15.5% |
| Mexican American Indians | 98.7 /100 | #90 | Exceptional 15.5% |
| Immigrants | Romania | 98.6 /100 | #91 | Exceptional 15.5% |
| Immigrants | Serbia | 98.5 /100 | #92 | Exceptional 15.5% |
| Basques | 98.4 /100 | #93 | Exceptional 15.5% |
| Immigrants | Uruguay | 98.2 /100 | #94 | Exceptional 15.6% |
| Immigrants | Kazakhstan | 98.2 /100 | #95 | Exceptional 15.6% |
| Immigrants | Belgium | 98.1 /100 | #96 | Exceptional 15.6% |
| Yaqui | 98.1 /100 | #97 | Exceptional 15.6% |
| Zimbabweans | 98.1 /100 | #98 | Exceptional 15.6% |