Moroccan vs Immigrants from Liberia Child Poverty Among Girls Under 16
COMPARE
Moroccan
Immigrants from Liberia
Child Poverty Among Girls Under 16
Child Poverty Among Girls Under 16 Comparison
Moroccans
Immigrants from Liberia
17.8%
CHILD POVERTY AMONG GIRLS UNDER 16
5.5/ 100
METRIC RATING
216th/ 347
METRIC RANK
20.2%
CHILD POVERTY AMONG GIRLS UNDER 16
0.0/ 100
METRIC RATING
280th/ 347
METRIC RANK
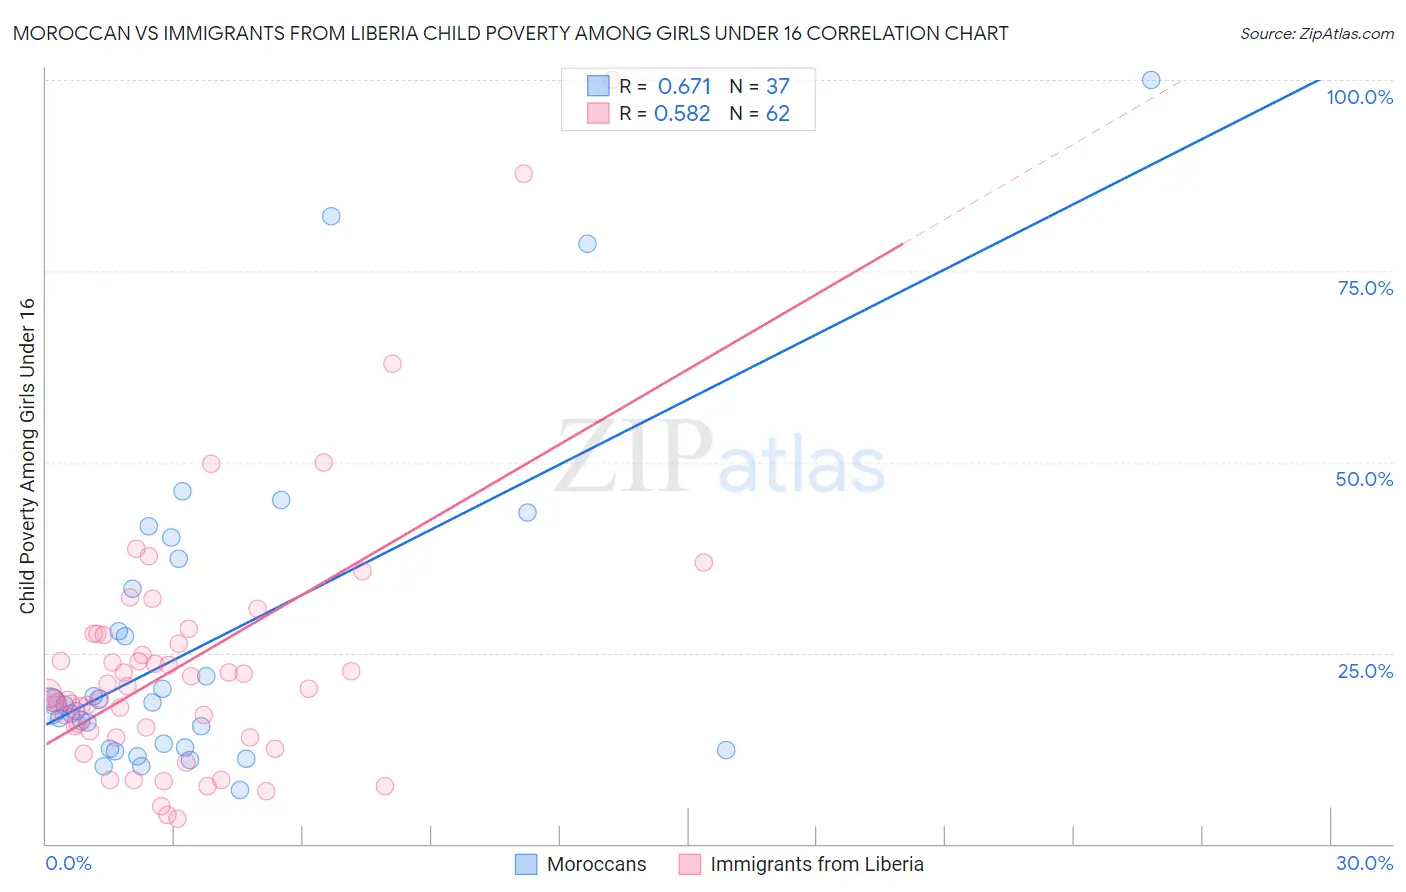
Moroccan vs Immigrants from Liberia Child Poverty Among Girls Under 16 Correlation Chart
The statistical analysis conducted on geographies consisting of 200,064,228 people shows a significant positive correlation between the proportion of Moroccans and poverty level among girls under the age of 16 in the United States with a correlation coefficient (R) of 0.671 and weighted average of 17.8%. Similarly, the statistical analysis conducted on geographies consisting of 134,725,271 people shows a substantial positive correlation between the proportion of Immigrants from Liberia and poverty level among girls under the age of 16 in the United States with a correlation coefficient (R) of 0.582 and weighted average of 20.2%, a difference of 13.6%.
Child Poverty Among Girls Under 16 Correlation Summary
| Measurement | Moroccan | Immigrants from Liberia |
| Minimum | 7.0% | 3.2% |
| Maximum | 100.0% | 100.0% |
| Range | 93.0% | 96.8% |
| Mean | 26.4% | 23.5% |
| Median | 18.1% | 20.0% |
| Interquartile 25% (IQ1) | 12.6% | 14.7% |
| Interquartile 75% (IQ3) | 35.4% | 27.4% |
| Interquartile Range (IQR) | 22.8% | 12.7% |
| Standard Deviation (Sample) | 21.4% | 17.2% |
| Standard Deviation (Population) | 21.1% | 17.1% |
Similar Demographics by Child Poverty Among Girls Under 16
Demographics Similar to Moroccans by Child Poverty Among Girls Under 16
In terms of child poverty among girls under 16, the demographic groups most similar to Moroccans are Japanese (17.8%, a difference of 0.090%), Malaysian (17.8%, a difference of 0.10%), German Russian (17.8%, a difference of 0.10%), Pennsylvania German (17.8%, a difference of 0.12%), and Alaska Native (17.8%, a difference of 0.18%).
| Demographics | Rating | Rank | Child Poverty Among Girls Under 16 |
| Panamanians | 8.7 /100 | #209 | Tragic 17.6% |
| Immigrants | Immigrants | 7.3 /100 | #210 | Tragic 17.7% |
| Immigrants | Eastern Africa | 6.4 /100 | #211 | Tragic 17.7% |
| Immigrants | Thailand | 6.3 /100 | #212 | Tragic 17.7% |
| Pennsylvania Germans | 5.7 /100 | #213 | Tragic 17.8% |
| Malaysians | 5.7 /100 | #214 | Tragic 17.8% |
| German Russians | 5.7 /100 | #215 | Tragic 17.8% |
| Moroccans | 5.5 /100 | #216 | Tragic 17.8% |
| Japanese | 5.3 /100 | #217 | Tragic 17.8% |
| Alaska Natives | 5.2 /100 | #218 | Tragic 17.8% |
| Immigrants | Panama | 4.7 /100 | #219 | Tragic 17.9% |
| Cubans | 4.1 /100 | #220 | Tragic 18.0% |
| Immigrants | Micronesia | 3.5 /100 | #221 | Tragic 18.0% |
| Immigrants | Cambodia | 2.9 /100 | #222 | Tragic 18.1% |
| Immigrants | Armenia | 2.9 /100 | #223 | Tragic 18.1% |
Demographics Similar to Immigrants from Liberia by Child Poverty Among Girls Under 16
In terms of child poverty among girls under 16, the demographic groups most similar to Immigrants from Liberia are Immigrants from Zaire (20.2%, a difference of 0.010%), Central American (20.2%, a difference of 0.070%), Barbadian (20.2%, a difference of 0.14%), Belizean (20.2%, a difference of 0.17%), and Comanche (20.2%, a difference of 0.28%).
| Demographics | Rating | Rank | Child Poverty Among Girls Under 16 |
| Bangladeshis | 0.1 /100 | #273 | Tragic 20.0% |
| Immigrants | St. Vincent and the Grenadines | 0.0 /100 | #274 | Tragic 20.1% |
| Sub-Saharan Africans | 0.0 /100 | #275 | Tragic 20.1% |
| Comanche | 0.0 /100 | #276 | Tragic 20.2% |
| Belizeans | 0.0 /100 | #277 | Tragic 20.2% |
| Barbadians | 0.0 /100 | #278 | Tragic 20.2% |
| Immigrants | Zaire | 0.0 /100 | #279 | Tragic 20.2% |
| Immigrants | Liberia | 0.0 /100 | #280 | Tragic 20.2% |
| Central Americans | 0.0 /100 | #281 | Tragic 20.2% |
| West Indians | 0.0 /100 | #282 | Tragic 20.3% |
| Senegalese | 0.0 /100 | #283 | Tragic 20.3% |
| Yaqui | 0.0 /100 | #284 | Tragic 20.3% |
| Immigrants | Cabo Verde | 0.0 /100 | #285 | Tragic 20.3% |
| Iroquois | 0.0 /100 | #286 | Tragic 20.4% |
| Blackfeet | 0.0 /100 | #287 | Tragic 20.5% |