Mexican vs Estonian Poverty
COMPARE
Mexican
Estonian
Poverty
Poverty Comparison
Mexicans
Estonians
15.1%
POVERTY
0.0/ 100
METRIC RATING
290th/ 347
METRIC RANK
11.1%
POVERTY
98.2/ 100
METRIC RATING
56th/ 347
METRIC RANK
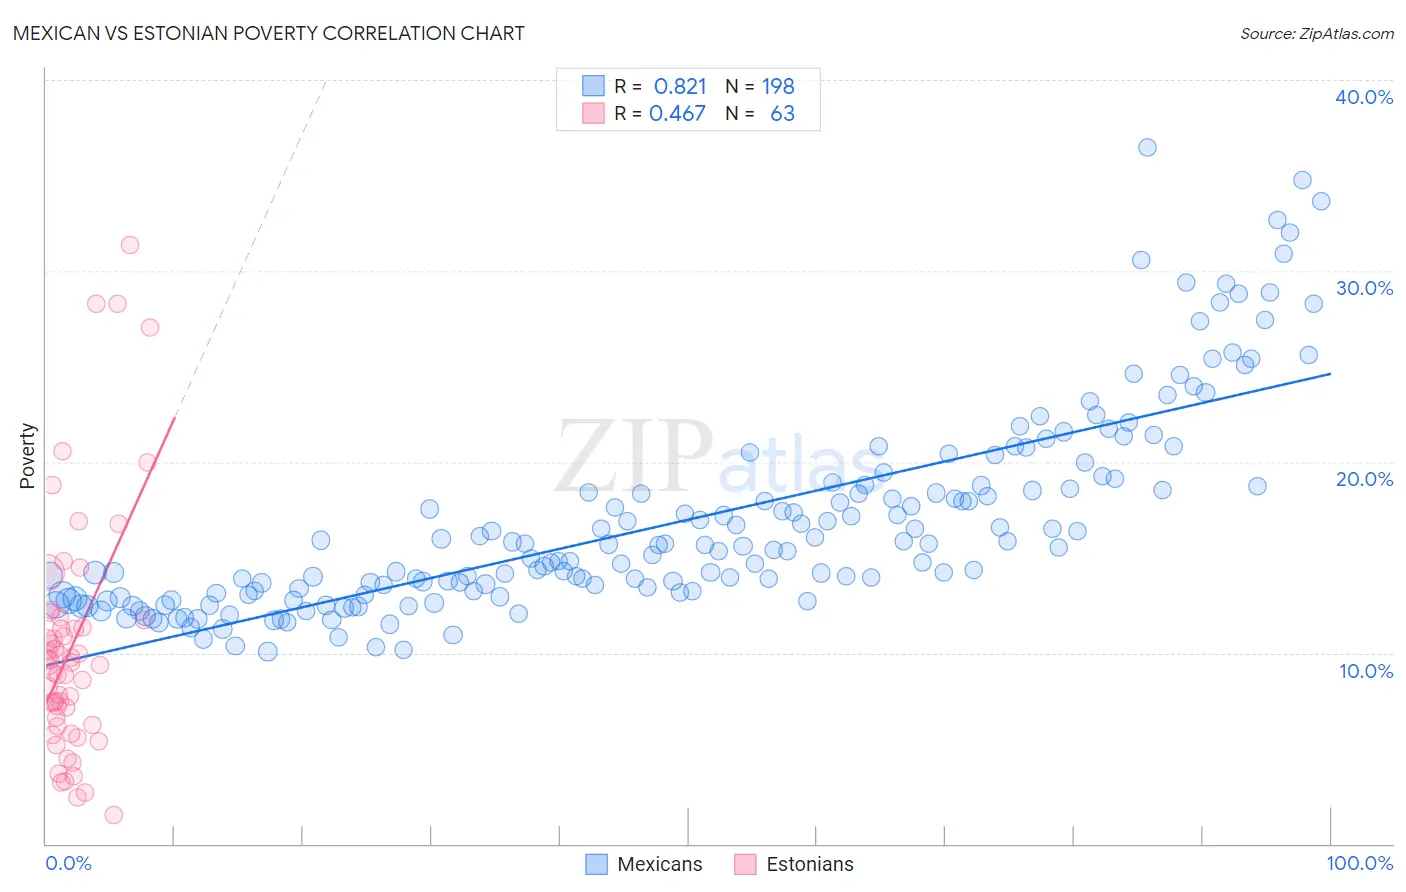
Mexican vs Estonian Poverty Correlation Chart
The statistical analysis conducted on geographies consisting of 564,427,713 people shows a very strong positive correlation between the proportion of Mexicans and poverty level in the United States with a correlation coefficient (R) of 0.821 and weighted average of 15.1%. Similarly, the statistical analysis conducted on geographies consisting of 123,503,598 people shows a moderate positive correlation between the proportion of Estonians and poverty level in the United States with a correlation coefficient (R) of 0.467 and weighted average of 11.1%, a difference of 35.8%.
Poverty Correlation Summary
| Measurement | Mexican | Estonian |
| Minimum | 10.1% | 1.5% |
| Maximum | 36.5% | 31.4% |
| Range | 26.4% | 29.8% |
| Mean | 16.9% | 10.3% |
| Median | 15.4% | 9.4% |
| Interquartile 25% (IQ1) | 13.1% | 6.2% |
| Interquartile 75% (IQ3) | 18.7% | 11.7% |
| Interquartile Range (IQR) | 5.6% | 5.5% |
| Standard Deviation (Sample) | 5.3% | 6.3% |
| Standard Deviation (Population) | 5.3% | 6.3% |
Similar Demographics by Poverty
Demographics Similar to Mexicans by Poverty
In terms of poverty, the demographic groups most similar to Mexicans are Immigrants from Belize (15.1%, a difference of 0.10%), Immigrants from Cabo Verde (15.1%, a difference of 0.13%), Indonesian (15.1%, a difference of 0.18%), Immigrants from Zaire (15.1%, a difference of 0.18%), and Yaqui (15.1%, a difference of 0.22%).
| Demographics | Rating | Rank | Poverty |
| Immigrants | Haiti | 0.0 /100 | #283 | Tragic 15.0% |
| West Indians | 0.0 /100 | #284 | Tragic 15.0% |
| Vietnamese | 0.0 /100 | #285 | Tragic 15.0% |
| Immigrants | Latin America | 0.0 /100 | #286 | Tragic 15.0% |
| Inupiat | 0.0 /100 | #287 | Tragic 15.1% |
| Yaqui | 0.0 /100 | #288 | Tragic 15.1% |
| Immigrants | Belize | 0.0 /100 | #289 | Tragic 15.1% |
| Mexicans | 0.0 /100 | #290 | Tragic 15.1% |
| Immigrants | Cabo Verde | 0.0 /100 | #291 | Tragic 15.1% |
| Indonesians | 0.0 /100 | #292 | Tragic 15.1% |
| Immigrants | Zaire | 0.0 /100 | #293 | Tragic 15.1% |
| Blackfeet | 0.0 /100 | #294 | Tragic 15.2% |
| Guatemalans | 0.0 /100 | #295 | Tragic 15.3% |
| Hispanics or Latinos | 0.0 /100 | #296 | Tragic 15.3% |
| Immigrants | Bangladesh | 0.0 /100 | #297 | Tragic 15.3% |
Demographics Similar to Estonians by Poverty
In terms of poverty, the demographic groups most similar to Estonians are Scandinavian (11.1%, a difference of 0.040%), German (11.1%, a difference of 0.10%), Immigrants from Europe (11.2%, a difference of 0.25%), Immigrants from Sri Lanka (11.2%, a difference of 0.42%), and Immigrants from Serbia (11.1%, a difference of 0.48%).
| Demographics | Rating | Rank | Poverty |
| Immigrants | Japan | 98.9 /100 | #49 | Exceptional 11.0% |
| Asians | 98.9 /100 | #50 | Exceptional 11.0% |
| Immigrants | Croatia | 98.7 /100 | #51 | Exceptional 11.0% |
| Immigrants | Philippines | 98.7 /100 | #52 | Exceptional 11.0% |
| Immigrants | Austria | 98.6 /100 | #53 | Exceptional 11.1% |
| Immigrants | Bulgaria | 98.5 /100 | #54 | Exceptional 11.1% |
| Immigrants | Serbia | 98.5 /100 | #55 | Exceptional 11.1% |
| Estonians | 98.2 /100 | #56 | Exceptional 11.1% |
| Scandinavians | 98.2 /100 | #57 | Exceptional 11.1% |
| Germans | 98.1 /100 | #58 | Exceptional 11.1% |
| Immigrants | Europe | 98.0 /100 | #59 | Exceptional 11.2% |
| Immigrants | Sri Lanka | 97.9 /100 | #60 | Exceptional 11.2% |
| Immigrants | Italy | 97.9 /100 | #61 | Exceptional 11.2% |
| Austrians | 97.8 /100 | #62 | Exceptional 11.2% |
| Ukrainians | 97.8 /100 | #63 | Exceptional 11.2% |