Mexican vs Choctaw Female Poverty Among 18-24 Year Olds
COMPARE
Mexican
Choctaw
Female Poverty Among 18-24 Year Olds
Female Poverty Among 18-24 Year Olds Comparison
Mexicans
Choctaw
20.5%
FEMALE POVERTY AMONG 18-24 YEAR OLDS
18.3/ 100
METRIC RATING
201st/ 347
METRIC RANK
24.3%
FEMALE POVERTY AMONG 18-24 YEAR OLDS
0.0/ 100
METRIC RATING
314th/ 347
METRIC RANK
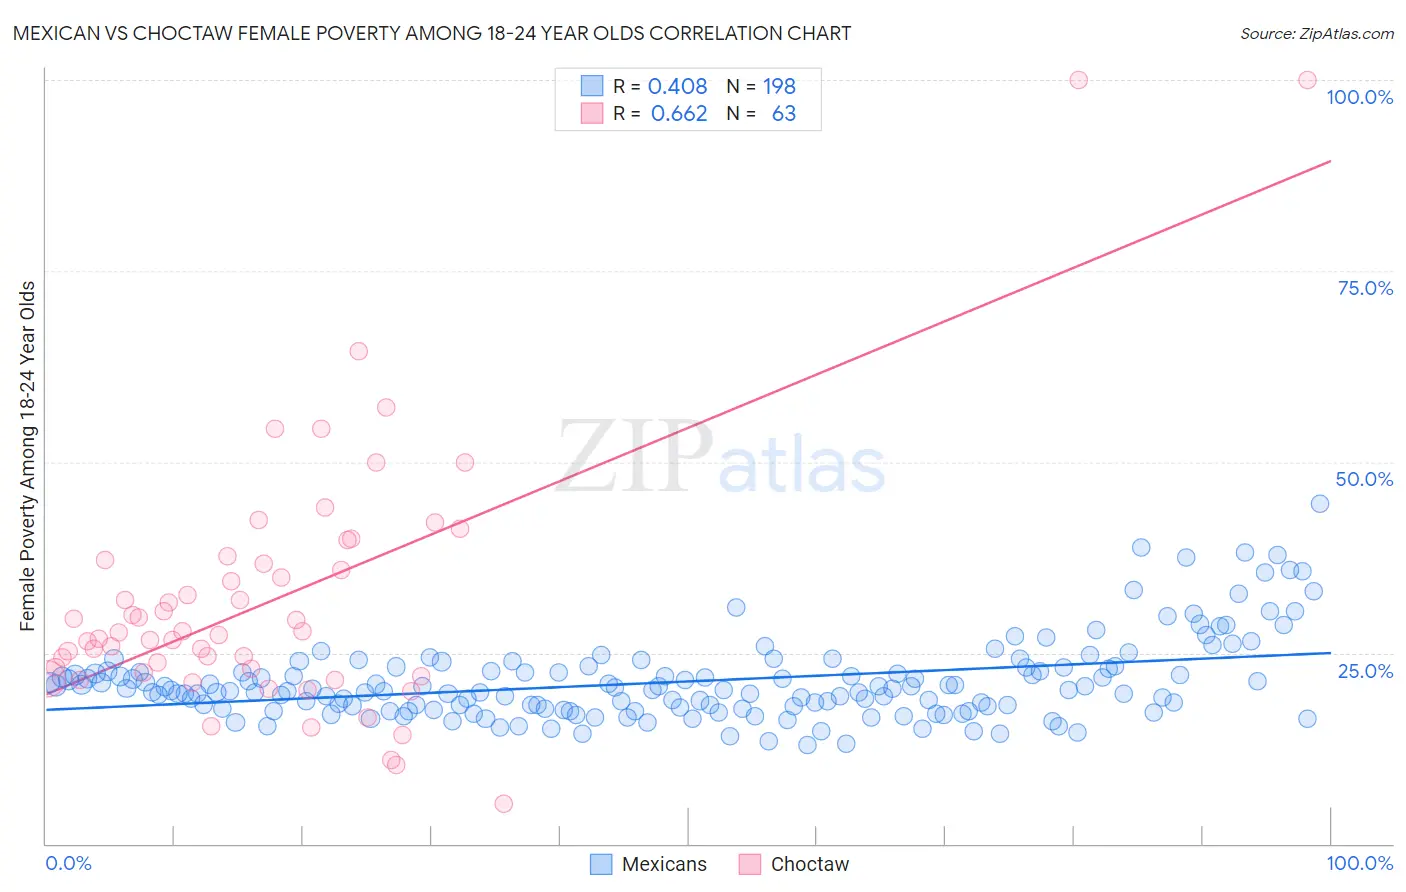
Mexican vs Choctaw Female Poverty Among 18-24 Year Olds Correlation Chart
The statistical analysis conducted on geographies consisting of 535,224,564 people shows a moderate positive correlation between the proportion of Mexicans and poverty level among females between the ages 18 and 24 in the United States with a correlation coefficient (R) of 0.408 and weighted average of 20.5%. Similarly, the statistical analysis conducted on geographies consisting of 265,726,107 people shows a significant positive correlation between the proportion of Choctaw and poverty level among females between the ages 18 and 24 in the United States with a correlation coefficient (R) of 0.662 and weighted average of 24.3%, a difference of 18.5%.
Female Poverty Among 18-24 Year Olds Correlation Summary
| Measurement | Mexican | Choctaw |
| Minimum | 12.9% | 5.3% |
| Maximum | 44.4% | 100.0% |
| Range | 31.6% | 94.7% |
| Mean | 21.2% | 32.0% |
| Median | 20.1% | 27.7% |
| Interquartile 25% (IQ1) | 17.8% | 22.4% |
| Interquartile 75% (IQ3) | 22.6% | 37.2% |
| Interquartile Range (IQR) | 4.7% | 14.8% |
| Standard Deviation (Sample) | 5.2% | 17.0% |
| Standard Deviation (Population) | 5.2% | 16.8% |
Similar Demographics by Female Poverty Among 18-24 Year Olds
Demographics Similar to Mexicans by Female Poverty Among 18-24 Year Olds
In terms of female poverty among 18-24 year olds, the demographic groups most similar to Mexicans are Immigrants from Turkey (20.5%, a difference of 0.050%), Immigrants from Malaysia (20.5%, a difference of 0.090%), Immigrants from Netherlands (20.5%, a difference of 0.11%), European (20.4%, a difference of 0.13%), and English (20.5%, a difference of 0.13%).
| Demographics | Rating | Rank | Female Poverty Among 18-24 Year Olds |
| Mexican American Indians | 23.2 /100 | #194 | Fair 20.4% |
| Immigrants | Latvia | 23.0 /100 | #195 | Fair 20.4% |
| Czechs | 22.3 /100 | #196 | Fair 20.4% |
| Zimbabweans | 21.0 /100 | #197 | Fair 20.4% |
| Immigrants | Spain | 20.7 /100 | #198 | Fair 20.4% |
| Germans | 20.6 /100 | #199 | Fair 20.4% |
| Europeans | 19.9 /100 | #200 | Poor 20.4% |
| Mexicans | 18.3 /100 | #201 | Poor 20.5% |
| Immigrants | Turkey | 17.7 /100 | #202 | Poor 20.5% |
| Immigrants | Malaysia | 17.2 /100 | #203 | Poor 20.5% |
| Immigrants | Netherlands | 17.0 /100 | #204 | Poor 20.5% |
| English | 16.7 /100 | #205 | Poor 20.5% |
| Hispanics or Latinos | 16.6 /100 | #206 | Poor 20.5% |
| Spaniards | 16.3 /100 | #207 | Poor 20.5% |
| Dutch | 15.9 /100 | #208 | Poor 20.5% |
Demographics Similar to Choctaw by Female Poverty Among 18-24 Year Olds
In terms of female poverty among 18-24 year olds, the demographic groups most similar to Choctaw are Creek (24.2%, a difference of 0.16%), Black/African American (24.3%, a difference of 0.20%), Alsatian (24.4%, a difference of 0.51%), Osage (24.5%, a difference of 0.81%), and Chickasaw (24.5%, a difference of 0.89%).
| Demographics | Rating | Rank | Female Poverty Among 18-24 Year Olds |
| Cree | 0.0 /100 | #307 | Tragic 23.4% |
| Immigrants | Sudan | 0.0 /100 | #308 | Tragic 23.5% |
| Blackfeet | 0.0 /100 | #309 | Tragic 23.6% |
| Comanche | 0.0 /100 | #310 | Tragic 23.6% |
| Potawatomi | 0.0 /100 | #311 | Tragic 23.7% |
| Yuman | 0.0 /100 | #312 | Tragic 24.0% |
| Creek | 0.0 /100 | #313 | Tragic 24.2% |
| Choctaw | 0.0 /100 | #314 | Tragic 24.3% |
| Blacks/African Americans | 0.0 /100 | #315 | Tragic 24.3% |
| Alsatians | 0.0 /100 | #316 | Tragic 24.4% |
| Osage | 0.0 /100 | #317 | Tragic 24.5% |
| Chickasaw | 0.0 /100 | #318 | Tragic 24.5% |
| Dutch West Indians | 0.0 /100 | #319 | Tragic 24.5% |
| Immigrants | Congo | 0.0 /100 | #320 | Tragic 24.6% |
| Immigrants | Zaire | 0.0 /100 | #321 | Tragic 25.1% |