Mexican vs Carpatho Rusyn Seniors Poverty Over the Age of 65

COMPARE

Mexican
Race
Ancestry
AfghanAfricanAlaska NativeAlaskan AthabascanAlbanianAleutAlsatianAmericanApacheArabArapahoArgentineanArmenianAssyrian/Chaldean/SyriacAustralianAustrianBahamianBangladeshiBarbadianBasqueBelgianBelizeanBermudanBhutaneseBlackfeetBolivianBrazilianBritishBritish West IndianBulgarianBurmeseCajunCambodianCanadianCape VerdeanCelticCentral AmericanCentral American IndianCherokeeCheyenneChickasawChileanChineseChippewaChoctawColombianColvilleComancheCosta RicanCreeCreekCroatianCrowCubanCypriotCzechCzechoslovakianDanishDelawareDominicanDutchDutch West IndianEastern EuropeanEcuadorianEgyptianEnglishEstonianEthiopianEuropeanFijianFilipinoFinnishFrenchFrench American IndianFrench CanadianGermanGerman RussianGhanaianGreekGuamanian/ChamorroGuatemalanGuyaneseHaitianHmongHonduranHopiHoumaHungarianIcelanderIndian (Asian)IndonesianInupiatIranianIraqiIrishIroquoisIsraeliItalianJamaicanJapaneseJordanianKenyanKiowaKoreanLaotianLatvianLebaneseLiberianLithuanianLumbeeLuxembourgerMacedonianMalaysianMalteseMarshalleseMenomineeMexicanMexican American IndianMongolianMoroccanNative HawaiianNavajoNepaleseNew ZealanderNicaraguanNigerianNorthern EuropeanNorwegianOkinawanOsageOttawaPaiutePakistaniPalestinianPanamanianParaguayanPennsylvania GermanPeruvianPimaPolishPortuguesePotawatomiPuebloPuerto RicanPuget Sound SalishRomanianRussianSalvadoranSamoanScandinavianScotch-IrishScottishSeminoleSenegaleseSerbianShoshoneSierra LeoneanSiouxSlavicSlovakSloveneSomaliSouth AfricanSouth AmericanSouth American IndianSoviet UnionSpaniardSpanishSpanish AmericanSpanish American IndianSri LankanSubsaharan AfricanSudaneseSwedishSwissSyrianTaiwaneseThaiTlingit-HaidaTohono O'OdhamTonganTrinidadian and TobagonianTsimshianTurkishU.S. Virgin IslanderUgandanUkrainianUruguayanUteVenezuelanVietnameseWelshWest IndianYakamaYaquiYugoslavianYumanYup'ikZimbabwean
Immigration
NonimmigrantsImmigrantsAfghanistanAfricaAlbaniaArgentinaArmeniaAsiaAustraliaAustriaBahamasBangladeshBarbadosBelarusBelgiumBelizeBoliviaBosnia and HerzegovinaBrazilBulgariaBurma/MyanmarCabo VerdeCambodiaCameroonCanadaCaribbeanCentral AmericaChileChinaColombiaCongoCosta RicaCroatiaCubaCzechoslovakiaDenmarkDominicaDominican RepublicEastern AfricaEastern AsiaEastern EuropeEcuadorEgyptEl SalvadorEnglandEritreaEthiopiaEuropeFijiFranceGermanyGhanaGreeceGrenadaGuatemalaGuyanaHaitiHondurasHong KongHungaryIndiaIndonesiaIranIraqIrelandIsraelItalyJamaicaJapanJordanKazakhstanKenyaKoreaKuwaitLaosLatin AmericaLatviaLebanonLiberiaLithuaniaMalaysiaMexicoMicronesiaMiddle AfricaMoldovaMoroccoNepalNetherlandsNicaraguaNigeriaNorth AmericaNorth MacedoniaNorthern AfricaNorthern EuropeNorwayOceaniaPakistanPanamaPeruPhilippinesPolandPortugalRomaniaRussiaSaudi ArabiaScotlandSenegalSerbiaSierra LeoneSingaporeSomaliaSouth AfricaSouth AmericaSouth Central AsiaSouth Eastern AsiaSouthern EuropeSpainSri LankaSt. Vincent and the GrenadinesSudanSwedenSwitzerlandSyriaTaiwanThailandTrinidad and TobagoTurkeyUgandaUkraineUruguayUzbekistanVenezuelaVietnamWest IndiesWestern AfricaWestern AsiaWestern EuropeYemenZaireZimbabweAzores
Carpatho Rusyn
Race
Ancestry
AfghanAfricanAlaska NativeAlaskan AthabascanAlbanianAleutAlsatianAmericanApacheArabArapahoArgentineanArmenianAssyrian/Chaldean/SyriacAustralianAustrianBahamianBangladeshiBarbadianBasqueBelgianBelizeanBermudanBhutaneseBlackfeetBolivianBrazilianBritishBritish West IndianBulgarianBurmeseCajunCambodianCanadianCape VerdeanCarpatho RusynCelticCentral AmericanCentral American IndianCherokeeCheyenneChickasawChileanChineseChippewaChoctawColombianColvilleComancheCosta RicanCreeCreekCroatianCrowCubanCypriotCzechCzechoslovakianDanishDelawareDominicanDutchDutch West IndianEastern EuropeanEcuadorianEgyptianEnglishEstonianEthiopianEuropeanFijianFilipinoFinnishFrenchFrench American IndianFrench CanadianGermanGerman RussianGhanaianGreekGuamanian/ChamorroGuatemalanGuyaneseHaitianHmongHonduranHopiHoumaHungarianIcelanderIndian (Asian)IndonesianInupiatIranianIraqiIrishIroquoisIsraeliItalianJamaicanJapaneseJordanianKenyanKiowaKoreanLaotianLatvianLebaneseLiberianLithuanianLumbeeLuxembourgerMacedonianMalaysianMalteseMarshalleseMenomineeMexican American IndianMongolianMoroccanNative HawaiianNavajoNepaleseNew ZealanderNicaraguanNigerianNorthern EuropeanNorwegianOkinawanOsageOttawaPaiutePakistaniPalestinianPanamanianParaguayanPennsylvania GermanPeruvianPimaPolishPortuguesePotawatomiPuebloPuerto RicanPuget Sound SalishRomanianRussianSalvadoranSamoanScandinavianScotch-IrishScottishSeminoleSenegaleseSerbianShoshoneSierra LeoneanSiouxSlavicSlovakSloveneSomaliSouth AfricanSouth AmericanSouth American IndianSoviet UnionSpaniardSpanishSpanish AmericanSpanish American IndianSri LankanSubsaharan AfricanSudaneseSwedishSwissSyrianTaiwaneseThaiTlingit-HaidaTohono O'OdhamTonganTrinidadian and TobagonianTsimshianTurkishU.S. Virgin IslanderUgandanUkrainianUruguayanUteVenezuelanVietnameseWelshWest IndianYakamaYaquiYugoslavianYumanYup'ikZimbabwean
Immigration
NonimmigrantsImmigrantsAfghanistanAfricaAlbaniaArgentinaArmeniaAsiaAustraliaAustriaBahamasBangladeshBarbadosBelarusBelgiumBelizeBoliviaBosnia and HerzegovinaBrazilBulgariaBurma/MyanmarCabo VerdeCambodiaCameroonCanadaCaribbeanCentral AmericaChileChinaColombiaCongoCosta RicaCroatiaCubaCzechoslovakiaDenmarkDominicaDominican RepublicEastern AfricaEastern AsiaEastern EuropeEcuadorEgyptEl SalvadorEnglandEritreaEthiopiaEuropeFijiFranceGermanyGhanaGreeceGrenadaGuatemalaGuyanaHaitiHondurasHong KongHungaryIndiaIndonesiaIranIraqIrelandIsraelItalyJamaicaJapanJordanKazakhstanKenyaKoreaKuwaitLaosLatin AmericaLatviaLebanonLiberiaLithuaniaMalaysiaMexicoMicronesiaMiddle AfricaMoldovaMoroccoNepalNetherlandsNicaraguaNigeriaNorth AmericaNorth MacedoniaNorthern AfricaNorthern EuropeNorwayOceaniaPakistanPanamaPeruPhilippinesPolandPortugalRomaniaRussiaSaudi ArabiaScotlandSenegalSerbiaSierra LeoneSingaporeSomaliaSouth AfricaSouth AmericaSouth Central AsiaSouth Eastern AsiaSouthern EuropeSpainSri LankaSt. Vincent and the GrenadinesSudanSwedenSwitzerlandSyriaTaiwanThailandTrinidad and TobagoTurkeyUgandaUkraineUruguayUzbekistanVenezuelaVietnamWest IndiesWestern AfricaWestern AsiaWestern EuropeYemenZaireZimbabweAzores
Seniors Poverty Over the Age of 65
Income
Poverty
Unemployment
Labor Participation
Family Structure
Vehicle Availability
Education Level
Disability

Seniors Poverty Over the Age of 65 Comparison

Mexicans

Carpatho Rusyns

Tragic
Exceptional
13.1%
SENIORS POVERTY OVER THE AGE OF 65
0.0/ 100
METRIC RATING
279th/ 347
METRIC RANK
9.7%
SENIORS POVERTY OVER THE AGE OF 65
99.3/ 100
METRIC RATING
51st/ 347
METRIC RANK

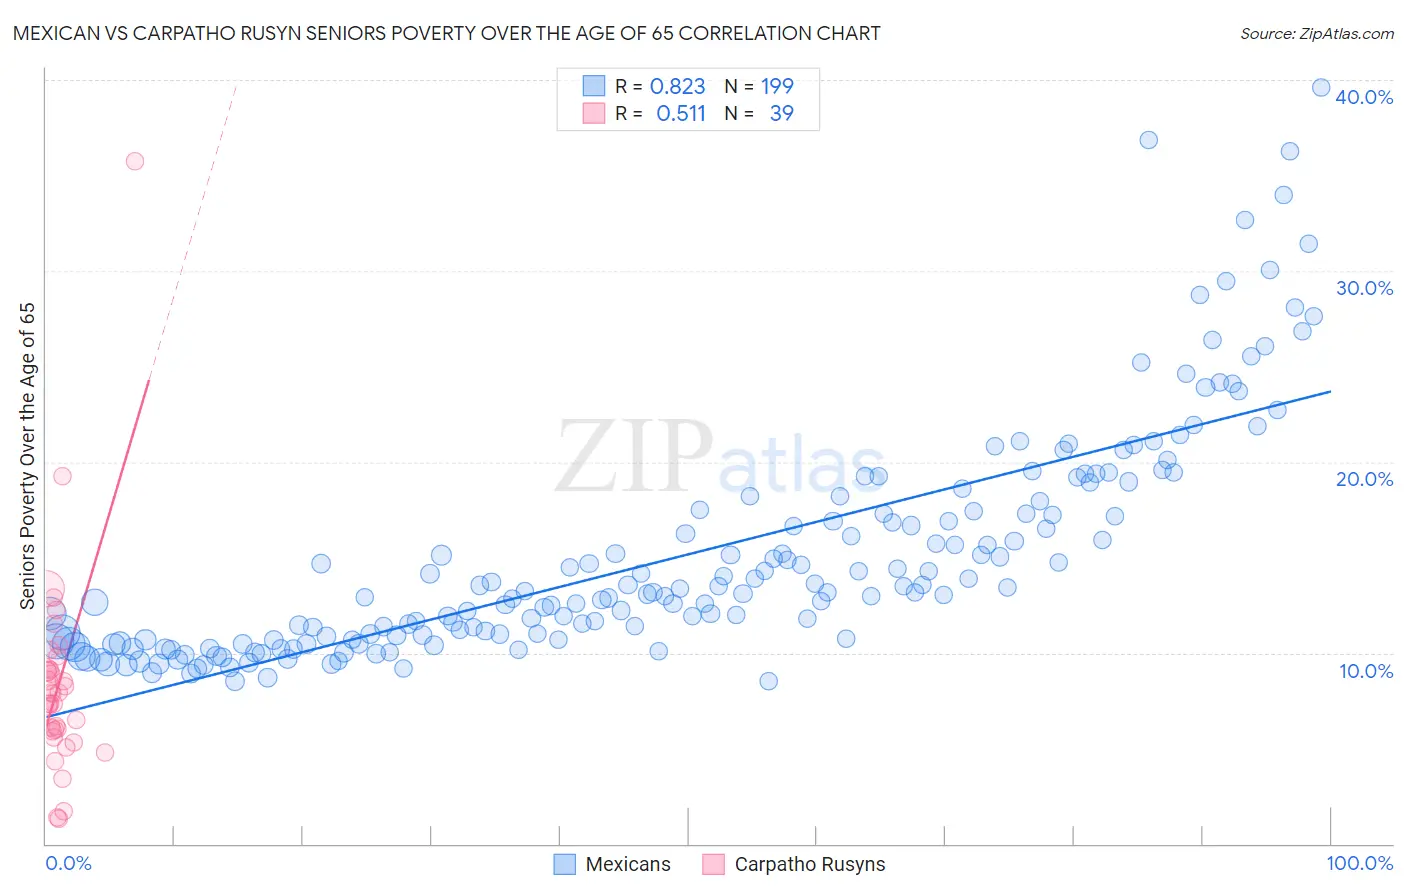
Mexican vs Carpatho Rusyn Seniors Poverty Over the Age of 65 Correlation Chart

The statistical analysis conducted on geographies consisting of 560,231,144 people shows a very strong positive correlation between the proportion of Mexicans and poverty level among seniors over the age of 65 in the United States with a correlation coefficient (R) of 0.823 and weighted average of 13.1%. Similarly, the statistical analysis conducted on geographies consisting of 58,841,096 people shows a substantial positive correlation between the proportion of Carpatho Rusyns and poverty level among seniors over the age of 65 in the United States with a correlation coefficient (R) of 0.511 and weighted average of 9.7%, a difference of 34.1%.
Mexican vs Carpatho Rusyn Seniors Poverty Over the Age of 65

Seniors Poverty Over the Age of 65 Correlation Summary

MeasurementMexicanCarpatho Rusyn
Minimum8.5%1.3%
Maximum39.6%35.7%
Range31.1%34.4%
Mean15.1%8.4%
Median13.2%7.8%
Interquartile 25% (IQ1)10.7%5.9%
Interquartile 75% (IQ3)17.4%9.2%
Interquartile Range (IQR)6.7%3.3%
Standard Deviation (Sample)6.0%5.6%
Standard Deviation (Population)6.0%5.6%

Similar Demographics by Seniors Poverty Over the Age of 65

Demographics Similar to Mexicans by Seniors Poverty Over the Age of 65

In terms of seniors poverty over the age of 65, the demographic groups most similar to Mexicans are Yuman (13.1%, a difference of 0.040%), Immigrants from Bahamas (13.0%, a difference of 0.16%), Immigrants from El Salvador (13.1%, a difference of 0.48%), Paiute (12.9%, a difference of 0.98%), and Immigrants from the Azores (12.9%, a difference of 1.1%).
DemographicsRating | RankSeniors Poverty Over the Age of 65
Immigrants | Uruguay
0.1
/100
|
#272
Tragic
12.8%
Kiowa
0.0
/100
|
#273
Tragic
12.8%
Salvadorans
0.0
/100
|
#274
Tragic
12.8%
Immigrants | Colombia
0.0
/100
|
#275
Tragic
12.9%
Immigrants | Azores
0.0
/100
|
#276
Tragic
12.9%
Paiute
0.0
/100
|
#277
Tragic
12.9%
Immigrants | Bahamas
0.0
/100
|
#278
Tragic
13.0%
Mexicans
0.0
/100
|
#279
Tragic
13.1%
Yuman
0.0
/100
|
#280
Tragic
13.1%
Immigrants | El Salvador
0.0
/100
|
#281
Tragic
13.1%
Senegalese
0.0
/100
|
#282
Tragic
13.3%
Central Americans
0.0
/100
|
#283
Tragic
13.4%
Colville
0.0
/100
|
#284
Tragic
13.5%
Guatemalans
0.0
/100
|
#285
Tragic
13.5%
Immigrants | Senegal
0.0
/100
|
#286
Tragic
13.6%

Demographics Similar to Carpatho Rusyns by Seniors Poverty Over the Age of 65

In terms of seniors poverty over the age of 65, the demographic groups most similar to Carpatho Rusyns are Filipino (9.7%, a difference of 0.020%), Slavic (9.8%, a difference of 0.13%), Immigrants from Northern Europe (9.8%, a difference of 0.19%), Afghan (9.8%, a difference of 0.31%), and Immigrants from England (9.8%, a difference of 0.43%).
DemographicsRating | RankSeniors Poverty Over the Age of 65
Austrians
99.5
/100
|
#44
Exceptional
9.6%
Estonians
99.5
/100
|
#45
Exceptional
9.6%
Immigrants | Taiwan
99.5
/100
|
#46
Exceptional
9.7%
Immigrants | South Central Asia
99.5
/100
|
#47
Exceptional
9.7%
French
99.5
/100
|
#48
Exceptional
9.7%
Immigrants | Lithuania
99.4
/100
|
#49
Exceptional
9.7%
Hungarians
99.4
/100
|
#50
Exceptional
9.7%
Carpatho Rusyns
99.3
/100
|
#51
Exceptional
9.7%
Filipinos
99.3
/100
|
#52
Exceptional
9.7%
Slavs
99.2
/100
|
#53
Exceptional
9.8%
Immigrants | Northern Europe
99.2
/100
|
#54
Exceptional
9.8%
Afghans
99.2
/100
|
#55
Exceptional
9.8%
Immigrants | England
99.1
/100
|
#56
Exceptional
9.8%
Bolivians
99.1
/100
|
#57
Exceptional
9.8%
Serbians
99.1
/100
|
#58
Exceptional
9.8%