Marshallese vs Ukrainian Married-Couple Family Poverty
COMPARE
Marshallese
Ukrainian
Married-Couple Family Poverty
Married-Couple Family Poverty Comparison
Marshallese
Ukrainians
5.2%
MARRIED-COUPLE FAMILY POVERTY
47.9/ 100
METRIC RATING
175th/ 347
METRIC RANK
4.5%
MARRIED-COUPLE FAMILY POVERTY
99.2/ 100
METRIC RATING
73rd/ 347
METRIC RANK
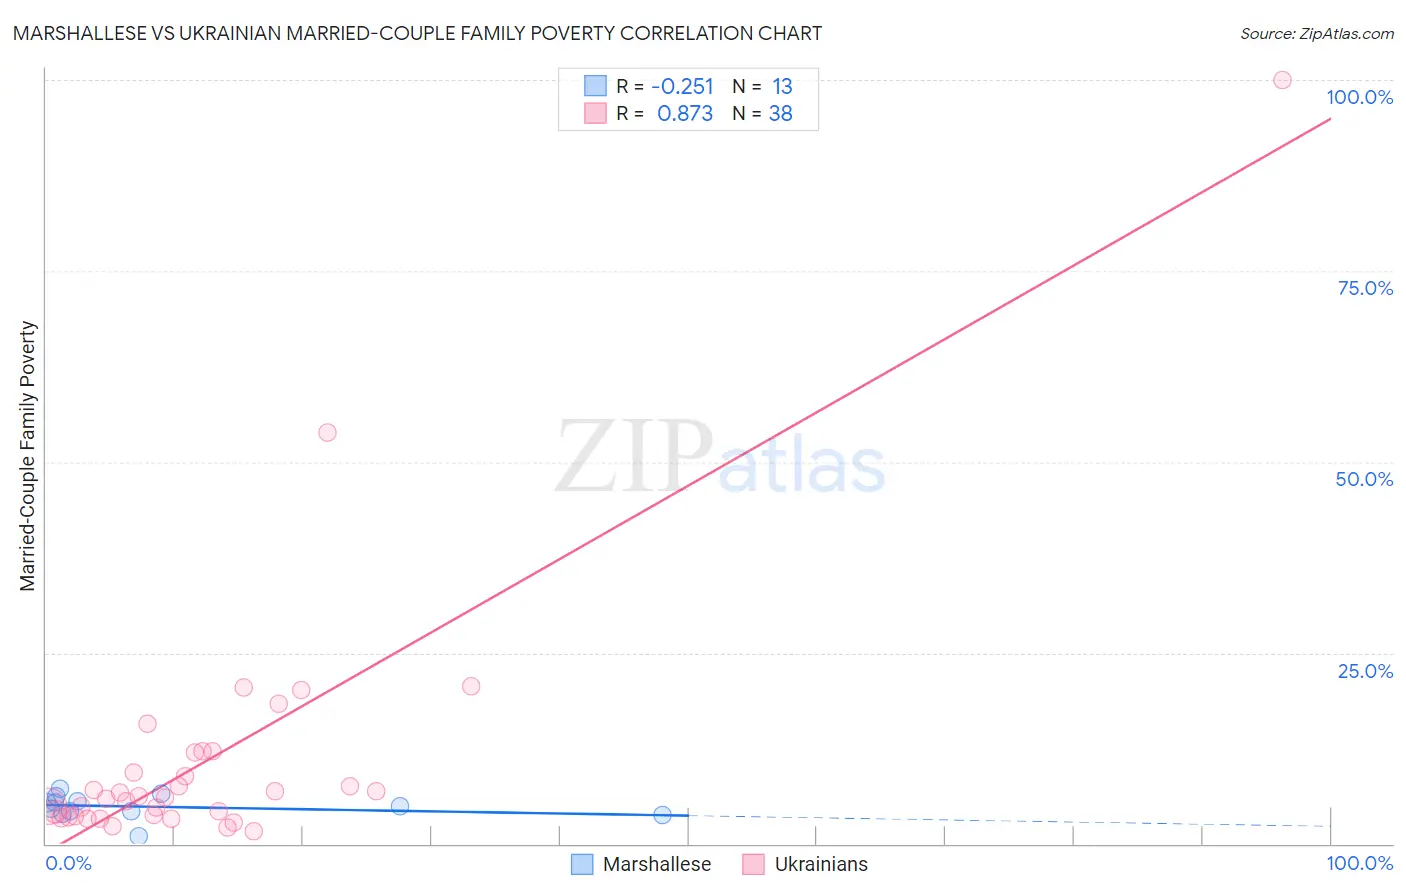
Marshallese vs Ukrainian Married-Couple Family Poverty Correlation Chart
The statistical analysis conducted on geographies consisting of 14,723,885 people shows a weak negative correlation between the proportion of Marshallese and poverty level among married-couple families in the United States with a correlation coefficient (R) of -0.251 and weighted average of 5.2%. Similarly, the statistical analysis conducted on geographies consisting of 441,666,258 people shows a very strong positive correlation between the proportion of Ukrainians and poverty level among married-couple families in the United States with a correlation coefficient (R) of 0.873 and weighted average of 4.5%, a difference of 16.8%.
Married-Couple Family Poverty Correlation Summary
| Measurement | Marshallese | Ukrainian |
| Minimum | 1.00% | 1.6% |
| Maximum | 7.2% | 100.0% |
| Range | 6.2% | 98.4% |
| Mean | 4.8% | 11.2% |
| Median | 4.9% | 6.1% |
| Interquartile 25% (IQ1) | 4.1% | 3.7% |
| Interquartile 75% (IQ3) | 5.9% | 12.0% |
| Interquartile Range (IQR) | 1.8% | 8.3% |
| Standard Deviation (Sample) | 1.6% | 17.4% |
| Standard Deviation (Population) | 1.5% | 17.2% |
Similar Demographics by Married-Couple Family Poverty
Demographics Similar to Marshallese by Married-Couple Family Poverty
In terms of married-couple family poverty, the demographic groups most similar to Marshallese are Menominee (5.2%, a difference of 0.010%), Immigrants from Eastern Africa (5.2%, a difference of 0.24%), Immigrants from Kazakhstan (5.2%, a difference of 0.33%), Immigrants from Ukraine (5.2%, a difference of 0.35%), and Alsatian (5.2%, a difference of 0.38%).
| Demographics | Rating | Rank | Married-Couple Family Poverty |
| Immigrants | Uganda | 54.9 /100 | #168 | Average 5.2% |
| Ottawa | 54.5 /100 | #169 | Average 5.2% |
| Immigrants | Argentina | 54.4 /100 | #170 | Average 5.2% |
| Bermudans | 52.9 /100 | #171 | Average 5.2% |
| Immigrants | Northern Africa | 51.3 /100 | #172 | Average 5.2% |
| Alsatians | 51.2 /100 | #173 | Average 5.2% |
| Immigrants | Eastern Africa | 50.0 /100 | #174 | Average 5.2% |
| Marshallese | 47.9 /100 | #175 | Average 5.2% |
| Menominee | 47.8 /100 | #176 | Average 5.2% |
| Immigrants | Kazakhstan | 45.1 /100 | #177 | Average 5.2% |
| Immigrants | Ukraine | 44.9 /100 | #178 | Average 5.2% |
| Spanish | 41.4 /100 | #179 | Average 5.3% |
| Immigrants | Sierra Leone | 39.3 /100 | #180 | Fair 5.3% |
| Immigrants | Chile | 38.8 /100 | #181 | Fair 5.3% |
| Immigrants | Vietnam | 37.7 /100 | #182 | Fair 5.3% |
Demographics Similar to Ukrainians by Married-Couple Family Poverty
In terms of married-couple family poverty, the demographic groups most similar to Ukrainians are Immigrants from Austria (4.5%, a difference of 0.10%), Immigrants from England (4.5%, a difference of 0.12%), Immigrants from North America (4.5%, a difference of 0.22%), Cambodian (4.5%, a difference of 0.37%), and Immigrants from South Africa (4.5%, a difference of 0.48%).
| Demographics | Rating | Rank | Married-Couple Family Poverty |
| Immigrants | Serbia | 99.4 /100 | #66 | Exceptional 4.4% |
| Immigrants | Canada | 99.4 /100 | #67 | Exceptional 4.4% |
| Slavs | 99.4 /100 | #68 | Exceptional 4.4% |
| New Zealanders | 99.4 /100 | #69 | Exceptional 4.4% |
| Immigrants | Korea | 99.4 /100 | #70 | Exceptional 4.5% |
| Immigrants | North America | 99.3 /100 | #71 | Exceptional 4.5% |
| Immigrants | England | 99.3 /100 | #72 | Exceptional 4.5% |
| Ukrainians | 99.2 /100 | #73 | Exceptional 4.5% |
| Immigrants | Austria | 99.2 /100 | #74 | Exceptional 4.5% |
| Cambodians | 99.2 /100 | #75 | Exceptional 4.5% |
| Immigrants | South Africa | 99.1 /100 | #76 | Exceptional 4.5% |
| Immigrants | Latvia | 99.1 /100 | #77 | Exceptional 4.5% |
| Scotch-Irish | 99.1 /100 | #78 | Exceptional 4.5% |
| Immigrants | Iran | 99.0 /100 | #79 | Exceptional 4.5% |
| Icelanders | 99.0 /100 | #80 | Exceptional 4.5% |