Marshallese vs Pima Female Poverty Among 18-24 Year Olds
COMPARE
Marshallese
Pima
Female Poverty Among 18-24 Year Olds
Female Poverty Among 18-24 Year Olds Comparison
Marshallese
Pima
20.9%
FEMALE POVERTY AMONG 18-24 YEAR OLDS
3.4/ 100
METRIC RATING
243rd/ 347
METRIC RANK
28.4%
FEMALE POVERTY AMONG 18-24 YEAR OLDS
0.0/ 100
METRIC RATING
339th/ 347
METRIC RANK
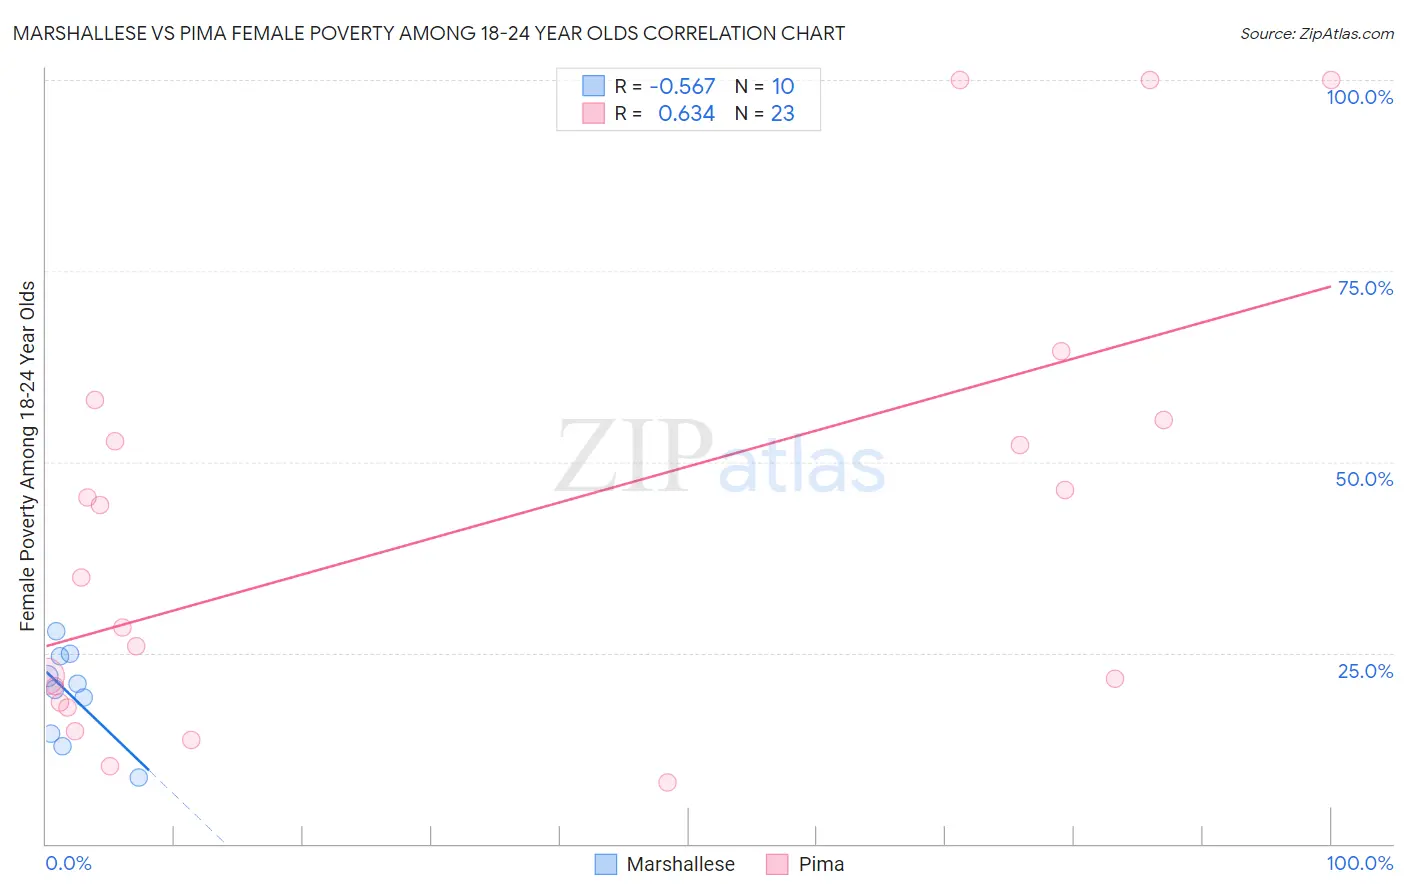
Marshallese vs Pima Female Poverty Among 18-24 Year Olds Correlation Chart
The statistical analysis conducted on geographies consisting of 14,709,952 people shows a substantial negative correlation between the proportion of Marshallese and poverty level among females between the ages 18 and 24 in the United States with a correlation coefficient (R) of -0.567 and weighted average of 20.9%. Similarly, the statistical analysis conducted on geographies consisting of 61,293,742 people shows a significant positive correlation between the proportion of Pima and poverty level among females between the ages 18 and 24 in the United States with a correlation coefficient (R) of 0.634 and weighted average of 28.4%, a difference of 35.8%.
Female Poverty Among 18-24 Year Olds Correlation Summary
| Measurement | Marshallese | Pima |
| Minimum | 8.7% | 8.0% |
| Maximum | 27.8% | 100.0% |
| Range | 19.1% | 92.0% |
| Mean | 19.5% | 41.5% |
| Median | 20.6% | 34.9% |
| Interquartile 25% (IQ1) | 14.4% | 18.5% |
| Interquartile 75% (IQ3) | 24.6% | 55.5% |
| Interquartile Range (IQR) | 10.2% | 37.0% |
| Standard Deviation (Sample) | 6.0% | 28.5% |
| Standard Deviation (Population) | 5.7% | 27.9% |
Similar Demographics by Female Poverty Among 18-24 Year Olds
Demographics Similar to Marshallese by Female Poverty Among 18-24 Year Olds
In terms of female poverty among 18-24 year olds, the demographic groups most similar to Marshallese are Immigrants from Thailand (20.9%, a difference of 0.010%), Aleut (20.9%, a difference of 0.040%), Immigrants from Australia (20.9%, a difference of 0.12%), Immigrants from Africa (21.0%, a difference of 0.18%), and Israeli (20.9%, a difference of 0.23%).
| Demographics | Rating | Rank | Female Poverty Among 18-24 Year Olds |
| Okinawans | 4.9 /100 | #236 | Tragic 20.8% |
| Scottish | 4.5 /100 | #237 | Tragic 20.9% |
| Immigrants | Singapore | 4.4 /100 | #238 | Tragic 20.9% |
| Immigrants | Guatemala | 4.3 /100 | #239 | Tragic 20.9% |
| Luxembourgers | 4.2 /100 | #240 | Tragic 20.9% |
| Immigrants | Eritrea | 4.2 /100 | #241 | Tragic 20.9% |
| Israelis | 4.1 /100 | #242 | Tragic 20.9% |
| Marshallese | 3.4 /100 | #243 | Tragic 20.9% |
| Immigrants | Thailand | 3.4 /100 | #244 | Tragic 20.9% |
| Aleuts | 3.3 /100 | #245 | Tragic 20.9% |
| Immigrants | Australia | 3.1 /100 | #246 | Tragic 20.9% |
| Immigrants | Africa | 3.0 /100 | #247 | Tragic 21.0% |
| Immigrants | Kenya | 2.5 /100 | #248 | Tragic 21.0% |
| Carpatho Rusyns | 2.5 /100 | #249 | Tragic 21.0% |
| Immigrants | West Indies | 2.2 /100 | #250 | Tragic 21.0% |
Demographics Similar to Pima by Female Poverty Among 18-24 Year Olds
In terms of female poverty among 18-24 year olds, the demographic groups most similar to Pima are Sioux (28.6%, a difference of 0.55%), Hopi (28.2%, a difference of 0.72%), Cheyenne (28.1%, a difference of 0.94%), Colville (29.0%, a difference of 2.1%), and Kiowa (29.2%, a difference of 2.9%).
| Demographics | Rating | Rank | Female Poverty Among 18-24 Year Olds |
| Houma | 0.0 /100 | #332 | Tragic 26.2% |
| Apache | 0.0 /100 | #333 | Tragic 26.3% |
| Pueblo | 0.0 /100 | #334 | Tragic 26.9% |
| Yup'ik | 0.0 /100 | #335 | Tragic 27.0% |
| Immigrants | Yemen | 0.0 /100 | #336 | Tragic 27.5% |
| Cheyenne | 0.0 /100 | #337 | Tragic 28.1% |
| Hopi | 0.0 /100 | #338 | Tragic 28.2% |
| Pima | 0.0 /100 | #339 | Tragic 28.4% |
| Sioux | 0.0 /100 | #340 | Tragic 28.6% |
| Colville | 0.0 /100 | #341 | Tragic 29.0% |
| Kiowa | 0.0 /100 | #342 | Tragic 29.2% |
| Puerto Ricans | 0.0 /100 | #343 | Tragic 29.8% |
| Navajo | 0.0 /100 | #344 | Tragic 30.3% |
| Tohono O'odham | 0.0 /100 | #345 | Tragic 31.0% |
| Lumbee | 0.0 /100 | #346 | Tragic 31.1% |