Marshallese vs Immigrants from Western Europe Seniors Poverty Over the Age of 65

COMPARE

Marshallese
Race
Ancestry
AfghanAfricanAlaska NativeAlaskan AthabascanAlbanianAleutAlsatianAmericanApacheArabArapahoArgentineanArmenianAssyrian/Chaldean/SyriacAustralianAustrianBahamianBangladeshiBarbadianBasqueBelgianBelizeanBermudanBhutaneseBlackfeetBolivianBrazilianBritishBritish West IndianBulgarianBurmeseCajunCambodianCanadianCape VerdeanCarpatho RusynCelticCentral AmericanCentral American IndianCherokeeCheyenneChickasawChileanChineseChippewaChoctawColombianColvilleComancheCosta RicanCreeCreekCroatianCrowCubanCypriotCzechCzechoslovakianDanishDelawareDominicanDutchDutch West IndianEastern EuropeanEcuadorianEgyptianEnglishEstonianEthiopianEuropeanFijianFilipinoFinnishFrenchFrench American IndianFrench CanadianGermanGerman RussianGhanaianGreekGuamanian/ChamorroGuatemalanGuyaneseHaitianHmongHonduranHopiHoumaHungarianIcelanderIndian (Asian)IndonesianInupiatIranianIraqiIrishIroquoisIsraeliItalianJamaicanJapaneseJordanianKenyanKiowaKoreanLaotianLatvianLebaneseLiberianLithuanianLumbeeLuxembourgerMacedonianMalaysianMalteseMarshalleseMenomineeMexicanMexican American IndianMongolianMoroccanNative HawaiianNavajoNepaleseNew ZealanderNicaraguanNigerianNorthern EuropeanNorwegianOkinawanOsageOttawaPaiutePakistaniPalestinianPanamanianParaguayanPennsylvania GermanPeruvianPimaPolishPortuguesePotawatomiPuebloPuerto RicanPuget Sound SalishRomanianRussianSalvadoranSamoanScandinavianScotch-IrishScottishSeminoleSenegaleseSerbianShoshoneSierra LeoneanSiouxSlavicSlovakSloveneSomaliSouth AfricanSouth AmericanSouth American IndianSoviet UnionSpaniardSpanishSpanish AmericanSpanish American IndianSri LankanSubsaharan AfricanSudaneseSwedishSwissSyrianTaiwaneseThaiTlingit-HaidaTohono O'OdhamTonganTrinidadian and TobagonianTsimshianTurkishU.S. Virgin IslanderUgandanUkrainianUruguayanUteVenezuelanVietnameseWelshWest IndianYakamaYaquiYugoslavianYumanYup'ikZimbabwean
Immigration
NonimmigrantsImmigrantsAfghanistanAfricaAlbaniaArgentinaArmeniaAsiaAustraliaAustriaBahamasBangladeshBarbadosBelarusBelgiumBelizeBoliviaBosnia and HerzegovinaBrazilBulgariaBurma/MyanmarCabo VerdeCambodiaCameroonCanadaCaribbeanCentral AmericaChileChinaColombiaCongoCosta RicaCroatiaCubaCzechoslovakiaDenmarkDominicaDominican RepublicEastern AfricaEastern AsiaEastern EuropeEcuadorEgyptEl SalvadorEnglandEritreaEthiopiaEuropeFijiFranceGermanyGhanaGreeceGrenadaGuatemalaGuyanaHaitiHondurasHong KongHungaryIndiaIndonesiaIranIraqIrelandIsraelItalyJamaicaJapanJordanKazakhstanKenyaKoreaKuwaitLaosLatin AmericaLatviaLebanonLiberiaLithuaniaMalaysiaMexicoMicronesiaMiddle AfricaMoldovaMoroccoNepalNetherlandsNicaraguaNigeriaNorth AmericaNorth MacedoniaNorthern AfricaNorthern EuropeNorwayOceaniaPakistanPanamaPeruPhilippinesPolandPortugalRomaniaRussiaSaudi ArabiaScotlandSenegalSerbiaSierra LeoneSingaporeSomaliaSouth AfricaSouth AmericaSouth Central AsiaSouth Eastern AsiaSouthern EuropeSpainSri LankaSt. Vincent and the GrenadinesSudanSwedenSwitzerlandSyriaTaiwanThailandTrinidad and TobagoTurkeyUgandaUkraineUruguayUzbekistanVenezuelaVietnamWest IndiesWestern AfricaWestern AsiaYemenZaireZimbabweAzores
Immigrants from Western Europe
Race
Ancestry
AfghanAfricanAlaska NativeAlaskan AthabascanAlbanianAleutAlsatianAmericanApacheArabArapahoArgentineanArmenianAssyrian/Chaldean/SyriacAustralianAustrianBahamianBangladeshiBarbadianBasqueBelgianBelizeanBermudanBhutaneseBlackfeetBolivianBrazilianBritishBritish West IndianBulgarianBurmeseCajunCambodianCanadianCape VerdeanCarpatho RusynCelticCentral AmericanCentral American IndianCherokeeCheyenneChickasawChileanChineseChippewaChoctawColombianColvilleComancheCosta RicanCreeCreekCroatianCrowCubanCypriotCzechCzechoslovakianDanishDelawareDominicanDutchDutch West IndianEastern EuropeanEcuadorianEgyptianEnglishEstonianEthiopianEuropeanFijianFilipinoFinnishFrenchFrench American IndianFrench CanadianGermanGerman RussianGhanaianGreekGuamanian/ChamorroGuatemalanGuyaneseHaitianHmongHonduranHopiHoumaHungarianIcelanderIndian (Asian)IndonesianInupiatIranianIraqiIrishIroquoisIsraeliItalianJamaicanJapaneseJordanianKenyanKiowaKoreanLaotianLatvianLebaneseLiberianLithuanianLumbeeLuxembourgerMacedonianMalaysianMalteseMenomineeMexicanMexican American IndianMongolianMoroccanNative HawaiianNavajoNepaleseNew ZealanderNicaraguanNigerianNorthern EuropeanNorwegianOkinawanOsageOttawaPaiutePakistaniPalestinianPanamanianParaguayanPennsylvania GermanPeruvianPimaPolishPortuguesePotawatomiPuebloPuerto RicanPuget Sound SalishRomanianRussianSalvadoranSamoanScandinavianScotch-IrishScottishSeminoleSenegaleseSerbianShoshoneSierra LeoneanSiouxSlavicSlovakSloveneSomaliSouth AfricanSouth AmericanSouth American IndianSoviet UnionSpaniardSpanishSpanish AmericanSpanish American IndianSri LankanSubsaharan AfricanSudaneseSwedishSwissSyrianTaiwaneseThaiTlingit-HaidaTohono O'OdhamTonganTrinidadian and TobagonianTsimshianTurkishU.S. Virgin IslanderUgandanUkrainianUruguayanUteVenezuelanVietnameseWelshWest IndianYakamaYaquiYugoslavianYumanYup'ikZimbabwean
Immigration
NonimmigrantsImmigrantsAfghanistanAfricaAlbaniaArgentinaArmeniaAsiaAustraliaAustriaBahamasBangladeshBarbadosBelarusBelgiumBelizeBoliviaBosnia and HerzegovinaBrazilBulgariaBurma/MyanmarCabo VerdeCambodiaCameroonCanadaCaribbeanCentral AmericaChileChinaColombiaCongoCosta RicaCroatiaCubaCzechoslovakiaDenmarkDominicaDominican RepublicEastern AfricaEastern AsiaEastern EuropeEcuadorEgyptEl SalvadorEnglandEritreaEthiopiaEuropeFijiFranceGermanyGhanaGreeceGrenadaGuatemalaGuyanaHaitiHondurasHong KongHungaryIndiaIndonesiaIranIraqIrelandIsraelItalyJamaicaJapanJordanKazakhstanKenyaKoreaKuwaitLaosLatin AmericaLatviaLebanonLiberiaLithuaniaMalaysiaMexicoMicronesiaMiddle AfricaMoldovaMoroccoNepalNetherlandsNicaraguaNigeriaNorth AmericaNorth MacedoniaNorthern AfricaNorthern EuropeNorwayOceaniaPakistanPanamaPeruPhilippinesPolandPortugalRomaniaRussiaSaudi ArabiaScotlandSenegalSerbiaSierra LeoneSingaporeSomaliaSouth AfricaSouth AmericaSouth Central AsiaSouth Eastern AsiaSouthern EuropeSpainSri LankaSt. Vincent and the GrenadinesSudanSwedenSwitzerlandSyriaTaiwanThailandTrinidad and TobagoTurkeyUgandaUkraineUruguayUzbekistanVenezuelaVietnamWest IndiesWestern AfricaWestern AsiaWestern EuropeYemenZaireZimbabweAzores
Seniors Poverty Over the Age of 65
Income
Poverty
Unemployment
Labor Participation
Family Structure
Vehicle Availability
Education Level
Disability

Seniors Poverty Over the Age of 65 Comparison

Marshallese

Immigrants from Western Europe

Exceptional
Exceptional
10.2%
SENIORS POVERTY OVER THE AGE OF 65
95.3/ 100
METRIC RATING
100th/ 347
METRIC RANK
10.4%
SENIORS POVERTY OVER THE AGE OF 65
91.1/ 100
METRIC RATING
119th/ 347
METRIC RANK

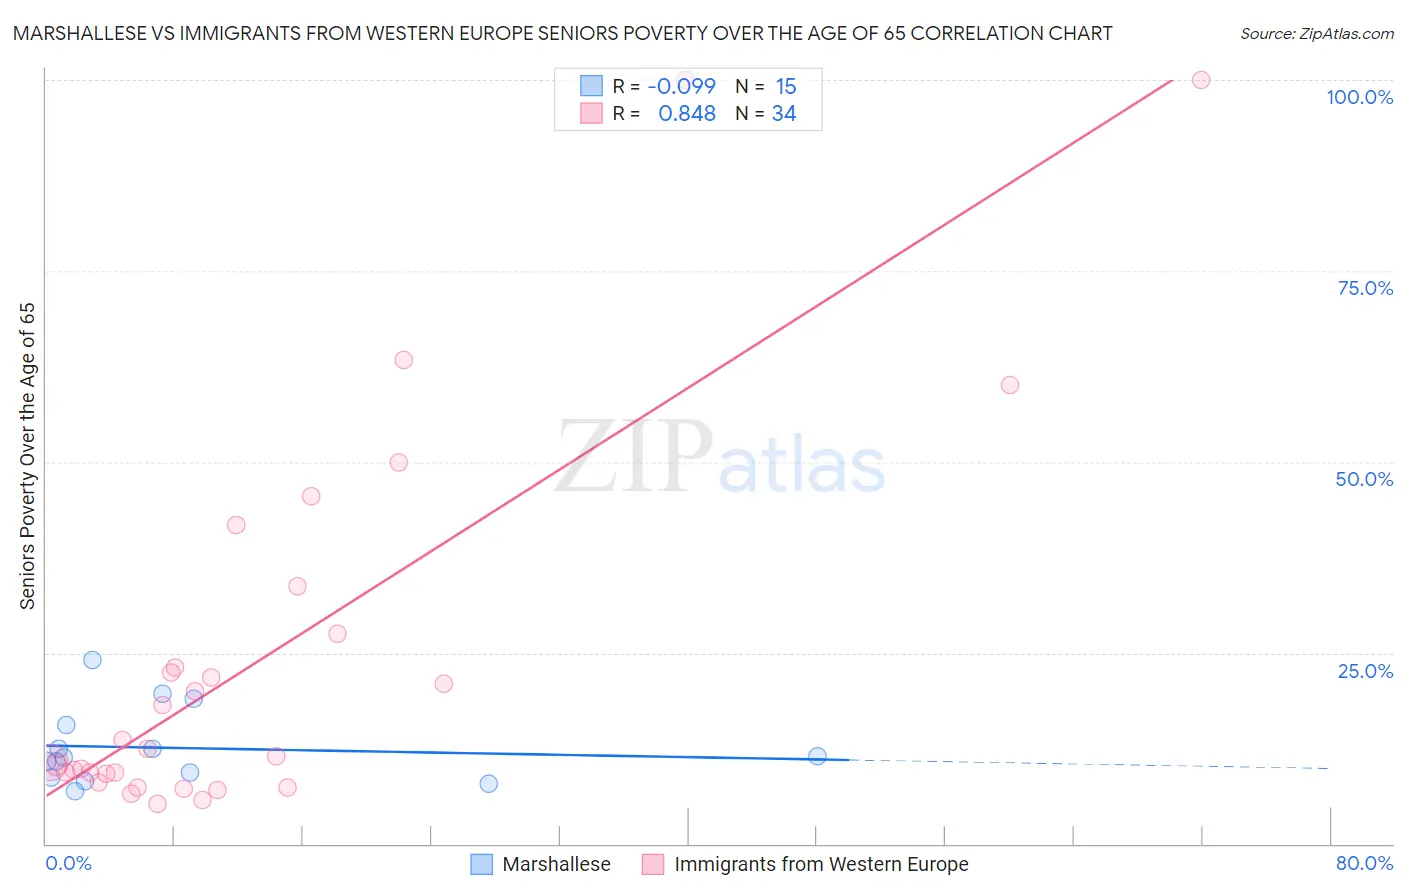
Marshallese vs Immigrants from Western Europe Seniors Poverty Over the Age of 65 Correlation Chart

The statistical analysis conducted on geographies consisting of 14,747,629 people shows a slight negative correlation between the proportion of Marshallese and poverty level among seniors over the age of 65 in the United States with a correlation coefficient (R) of -0.099 and weighted average of 10.2%. Similarly, the statistical analysis conducted on geographies consisting of 491,602,141 people shows a very strong positive correlation between the proportion of Immigrants from Western Europe and poverty level among seniors over the age of 65 in the United States with a correlation coefficient (R) of 0.848 and weighted average of 10.4%, a difference of 1.7%.
Marshallese vs Immigrants from Western Europe Seniors Poverty Over the Age of 65

Seniors Poverty Over the Age of 65 Correlation Summary

MeasurementMarshalleseImmigrants from Western Europe
Minimum6.8%5.2%
Maximum24.1%100.0%
Range17.3%94.8%
Mean12.5%24.1%
Median11.2%12.0%
Interquartile 25% (IQ1)8.6%9.2%
Interquartile 75% (IQ3)15.5%27.6%
Interquartile Range (IQR)6.9%18.3%
Standard Deviation (Sample)4.9%24.9%
Standard Deviation (Population)4.8%24.5%

Demographics Similar to Marshallese and Immigrants from Western Europe by Seniors Poverty Over the Age of 65

In terms of seniors poverty over the age of 65, the demographic groups most similar to Marshallese are Cypriot (10.2%, a difference of 0.070%), Immigrants from Jordan (10.2%, a difference of 0.32%), Delaware (10.2%, a difference of 0.42%), Icelander (10.3%, a difference of 0.47%), and South African (10.3%, a difference of 0.51%). Similarly, the demographic groups most similar to Immigrants from Western Europe are Okinawan (10.4%, a difference of 0.19%), Lebanese (10.3%, a difference of 0.27%), Pakistani (10.3%, a difference of 0.33%), Immigrants from Italy (10.3%, a difference of 0.49%), and Immigrants from Denmark (10.3%, a difference of 0.52%).
DemographicsRating | RankSeniors Poverty Over the Age of 65
Cypriots
95.5
/100
|
#99
Exceptional
10.2%
Marshallese
95.3
/100
|
#100
Exceptional
10.2%
Immigrants | Jordan
94.7
/100
|
#101
Exceptional
10.2%
Delaware
94.5
/100
|
#102
Exceptional
10.2%
Icelanders
94.4
/100
|
#103
Exceptional
10.3%
South Africans
94.3
/100
|
#104
Exceptional
10.3%
Aleuts
94.1
/100
|
#105
Exceptional
10.3%
Kenyans
94.1
/100
|
#106
Exceptional
10.3%
Hawaiians
93.9
/100
|
#107
Exceptional
10.3%
Immigrants | Croatia
93.9
/100
|
#108
Exceptional
10.3%
Syrians
93.8
/100
|
#109
Exceptional
10.3%
Immigrants | Zimbabwe
93.5
/100
|
#110
Exceptional
10.3%
Immigrants | Belgium
93.4
/100
|
#111
Exceptional
10.3%
Immigrants | Korea
93.3
/100
|
#112
Exceptional
10.3%
Immigrants | Romania
93.3
/100
|
#113
Exceptional
10.3%
Immigrants | Denmark
92.7
/100
|
#114
Exceptional
10.3%
Immigrants | Italy
92.6
/100
|
#115
Exceptional
10.3%
Pakistanis
92.2
/100
|
#116
Exceptional
10.3%
Lebanese
92.0
/100
|
#117
Exceptional
10.3%
Okinawans
91.7
/100
|
#118
Exceptional
10.4%
Immigrants | Western Europe
91.1
/100
|
#119
Exceptional
10.4%