Malaysian vs Trinidadian and Tobagonian Seniors Poverty Over the Age of 75
COMPARE
Malaysian
Trinidadian and Tobagonian
Seniors Poverty Over the Age of 75
Seniors Poverty Over the Age of 75 Comparison
Malaysians
Trinidadians and Tobagonians
11.8%
SENIORS POVERTY OVER THE AGE OF 75
84.1/ 100
METRIC RATING
121st/ 347
METRIC RANK
15.9%
SENIORS POVERTY OVER THE AGE OF 75
0.0/ 100
METRIC RATING
311th/ 347
METRIC RANK
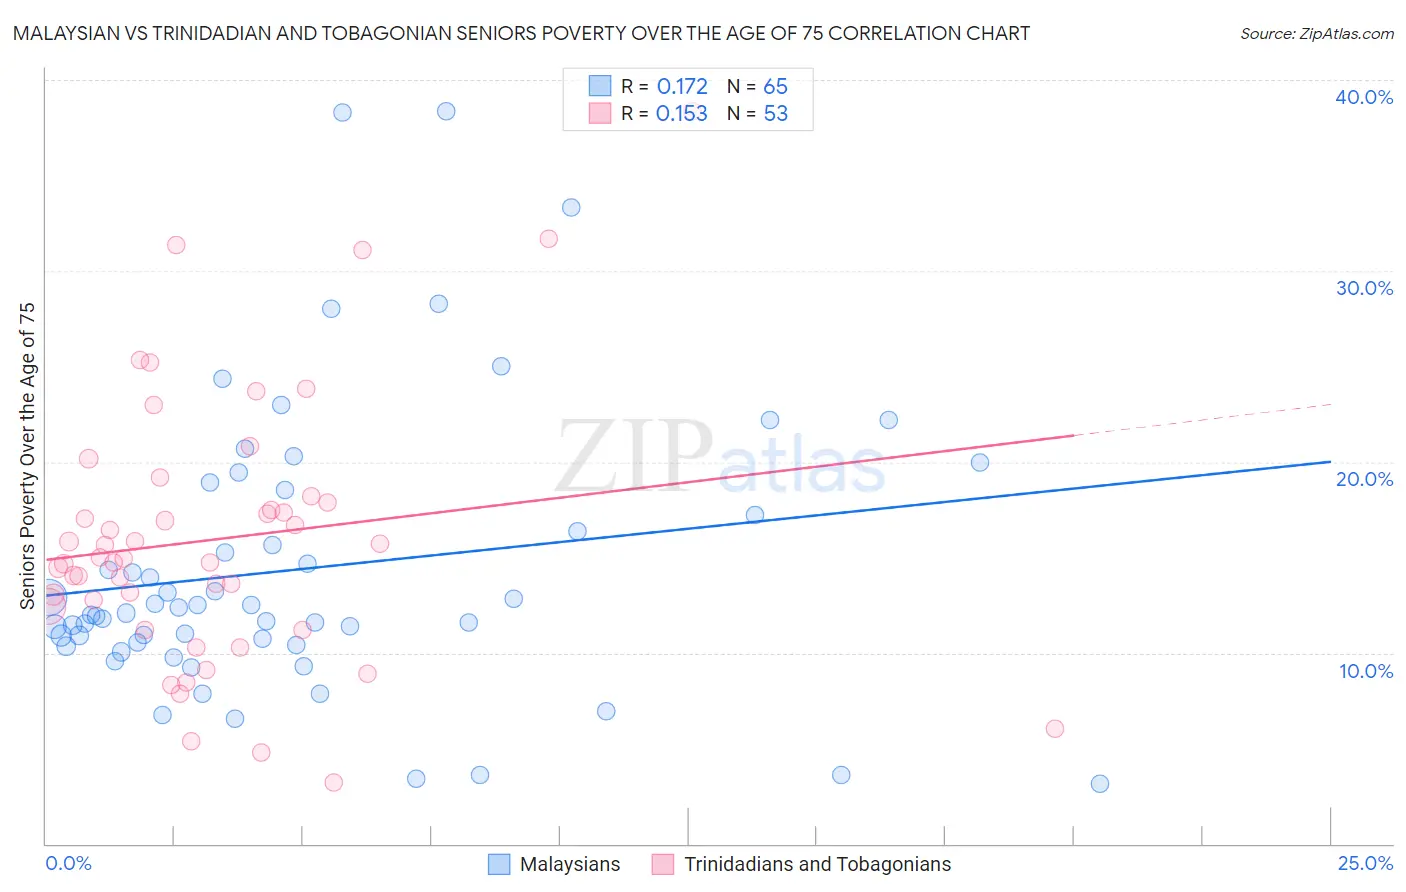
Malaysian vs Trinidadian and Tobagonian Seniors Poverty Over the Age of 75 Correlation Chart
The statistical analysis conducted on geographies consisting of 224,603,376 people shows a poor positive correlation between the proportion of Malaysians and poverty level among seniors over the age of 75 in the United States with a correlation coefficient (R) of 0.172 and weighted average of 11.8%. Similarly, the statistical analysis conducted on geographies consisting of 218,354,994 people shows a poor positive correlation between the proportion of Trinidadians and Tobagonians and poverty level among seniors over the age of 75 in the United States with a correlation coefficient (R) of 0.153 and weighted average of 15.9%, a difference of 34.8%.
Seniors Poverty Over the Age of 75 Correlation Summary
| Measurement | Malaysian | Trinidadian and Tobagonian |
| Minimum | 3.2% | 3.2% |
| Maximum | 38.4% | 38.3% |
| Range | 35.2% | 35.1% |
| Mean | 14.4% | 16.0% |
| Median | 12.1% | 14.9% |
| Interquartile 25% (IQ1) | 10.5% | 11.8% |
| Interquartile 75% (IQ3) | 17.9% | 18.0% |
| Interquartile Range (IQR) | 7.4% | 6.2% |
| Standard Deviation (Sample) | 7.4% | 7.0% |
| Standard Deviation (Population) | 7.4% | 7.0% |
Similar Demographics by Seniors Poverty Over the Age of 75
Demographics Similar to Malaysians by Seniors Poverty Over the Age of 75
In terms of seniors poverty over the age of 75, the demographic groups most similar to Malaysians are Pakistani (11.8%, a difference of 0.010%), Immigrants from Italy (11.8%, a difference of 0.010%), Fijian (11.8%, a difference of 0.040%), Sudanese (11.8%, a difference of 0.070%), and Immigrants from Nepal (11.8%, a difference of 0.080%).
| Demographics | Rating | Rank | Seniors Poverty Over the Age of 75 |
| Ukrainians | 86.9 /100 | #114 | Excellent 11.7% |
| New Zealanders | 86.3 /100 | #115 | Excellent 11.7% |
| Iraqis | 86.3 /100 | #116 | Excellent 11.7% |
| Icelanders | 85.7 /100 | #117 | Excellent 11.7% |
| Immigrants | Zimbabwe | 85.5 /100 | #118 | Excellent 11.7% |
| Immigrants | Uganda | 84.8 /100 | #119 | Excellent 11.8% |
| Immigrants | Nepal | 84.5 /100 | #120 | Excellent 11.8% |
| Malaysians | 84.1 /100 | #121 | Excellent 11.8% |
| Pakistanis | 84.0 /100 | #122 | Excellent 11.8% |
| Immigrants | Italy | 84.0 /100 | #123 | Excellent 11.8% |
| Fijians | 83.8 /100 | #124 | Excellent 11.8% |
| Sudanese | 83.6 /100 | #125 | Excellent 11.8% |
| Pennsylvania Germans | 83.4 /100 | #126 | Excellent 11.8% |
| Immigrants | Denmark | 82.6 /100 | #127 | Excellent 11.8% |
| Immigrants | Hungary | 81.7 /100 | #128 | Excellent 11.8% |
Demographics Similar to Trinidadians and Tobagonians by Seniors Poverty Over the Age of 75
In terms of seniors poverty over the age of 75, the demographic groups most similar to Trinidadians and Tobagonians are Vietnamese (15.9%, a difference of 0.10%), Yup'ik (15.8%, a difference of 0.20%), Crow (15.9%, a difference of 0.41%), Immigrants from Bangladesh (15.8%, a difference of 0.50%), and Immigrants from West Indies (15.8%, a difference of 0.55%).
| Demographics | Rating | Rank | Seniors Poverty Over the Age of 75 |
| Immigrants | Trinidad and Tobago | 0.0 /100 | #304 | Tragic 15.7% |
| Ecuadorians | 0.0 /100 | #305 | Tragic 15.7% |
| Hispanics or Latinos | 0.0 /100 | #306 | Tragic 15.8% |
| Immigrants | West Indies | 0.0 /100 | #307 | Tragic 15.8% |
| Immigrants | Bangladesh | 0.0 /100 | #308 | Tragic 15.8% |
| Yup'ik | 0.0 /100 | #309 | Tragic 15.8% |
| Vietnamese | 0.0 /100 | #310 | Tragic 15.9% |
| Trinidadians and Tobagonians | 0.0 /100 | #311 | Tragic 15.9% |
| Crow | 0.0 /100 | #312 | Tragic 15.9% |
| Barbadians | 0.0 /100 | #313 | Tragic 16.0% |
| Tsimshian | 0.0 /100 | #314 | Tragic 16.1% |
| Guyanese | 0.0 /100 | #315 | Tragic 16.1% |
| Immigrants | Ecuador | 0.0 /100 | #316 | Tragic 16.1% |
| Immigrants | Guyana | 0.0 /100 | #317 | Tragic 16.2% |
| Houma | 0.0 /100 | #318 | Tragic 16.2% |