Malaysian vs Marshallese Family Poverty
COMPARE
Malaysian
Marshallese
Family Poverty
Family Poverty Comparison
Malaysians
Marshallese
9.6%
FAMILY POVERTY
10.6/ 100
METRIC RATING
211th/ 347
METRIC RANK
9.9%
FAMILY POVERTY
3.9/ 100
METRIC RATING
224th/ 347
METRIC RANK
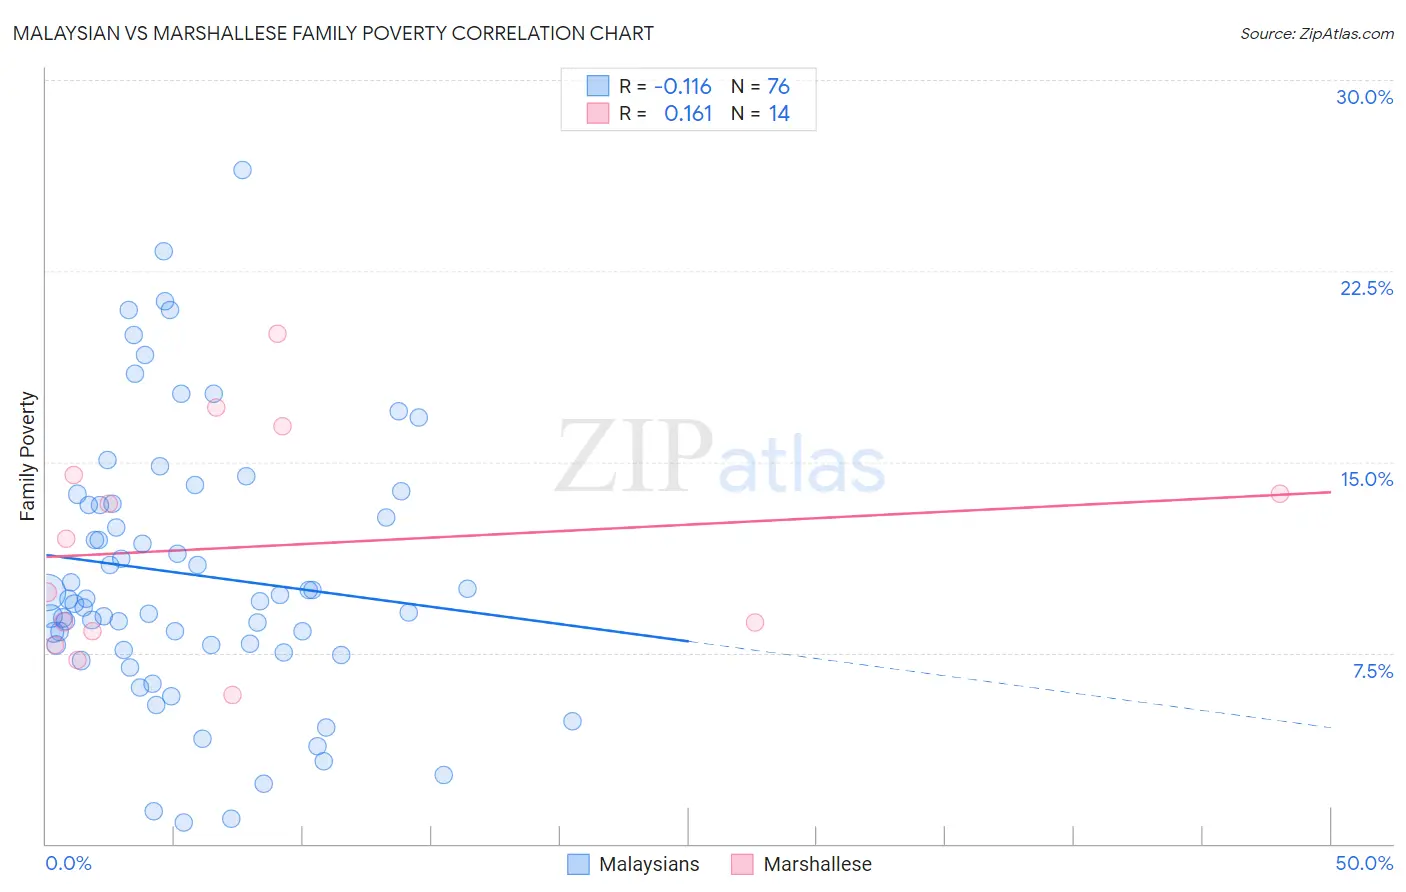
Malaysian vs Marshallese Family Poverty Correlation Chart
The statistical analysis conducted on geographies consisting of 225,820,705 people shows a poor negative correlation between the proportion of Malaysians and poverty level among families in the United States with a correlation coefficient (R) of -0.116 and weighted average of 9.6%. Similarly, the statistical analysis conducted on geographies consisting of 14,754,460 people shows a poor positive correlation between the proportion of Marshallese and poverty level among families in the United States with a correlation coefficient (R) of 0.161 and weighted average of 9.9%, a difference of 3.3%.
Family Poverty Correlation Summary
| Measurement | Malaysian | Marshallese |
| Minimum | 0.81% | 5.8% |
| Maximum | 26.5% | 20.0% |
| Range | 25.6% | 14.2% |
| Mean | 10.6% | 11.7% |
| Median | 9.6% | 10.9% |
| Interquartile 25% (IQ1) | 7.7% | 8.3% |
| Interquartile 75% (IQ3) | 13.3% | 14.5% |
| Interquartile Range (IQR) | 5.6% | 6.1% |
| Standard Deviation (Sample) | 5.3% | 4.3% |
| Standard Deviation (Population) | 5.3% | 4.1% |
Demographics Similar to Malaysians and Marshallese by Family Poverty
In terms of family poverty, the demographic groups most similar to Malaysians are Alsatian (9.6%, a difference of 0.23%), Immigrants from Thailand (9.7%, a difference of 0.30%), Osage (9.7%, a difference of 0.94%), Immigrants from Uruguay (9.5%, a difference of 0.97%), and Immigrants from Eastern Africa (9.5%, a difference of 1.3%). Similarly, the demographic groups most similar to Marshallese are Immigrants (10.0%, a difference of 0.25%), Immigrants from Africa (9.9%, a difference of 0.30%), Ottawa (10.0%, a difference of 0.52%), Immigrants from Armenia (10.0%, a difference of 0.54%), and Japanese (9.9%, a difference of 0.60%).
| Demographics | Rating | Rank | Family Poverty |
| Sierra Leoneans | 15.6 /100 | #207 | Poor 9.5% |
| Immigrants | Eastern Africa | 15.1 /100 | #208 | Poor 9.5% |
| Immigrants | Uruguay | 14.0 /100 | #209 | Poor 9.5% |
| Alsatians | 11.3 /100 | #210 | Poor 9.6% |
| Malaysians | 10.6 /100 | #211 | Poor 9.6% |
| Immigrants | Thailand | 9.7 /100 | #212 | Tragic 9.7% |
| Osage | 8.0 /100 | #213 | Tragic 9.7% |
| Immigrants | Micronesia | 6.7 /100 | #214 | Tragic 9.8% |
| Immigrants | Nonimmigrants | 6.7 /100 | #215 | Tragic 9.8% |
| Moroccans | 6.5 /100 | #216 | Tragic 9.8% |
| Americans | 6.2 /100 | #217 | Tragic 9.8% |
| Panamanians | 5.6 /100 | #218 | Tragic 9.8% |
| Immigrants | Eritrea | 5.4 /100 | #219 | Tragic 9.9% |
| Bermudans | 5.3 /100 | #220 | Tragic 9.9% |
| Immigrants | Cambodia | 4.8 /100 | #221 | Tragic 9.9% |
| Japanese | 4.8 /100 | #222 | Tragic 9.9% |
| Immigrants | Africa | 4.3 /100 | #223 | Tragic 9.9% |
| Marshallese | 3.9 /100 | #224 | Tragic 9.9% |
| Immigrants | Immigrants | 3.6 /100 | #225 | Tragic 10.0% |
| Ottawa | 3.3 /100 | #226 | Tragic 10.0% |
| Immigrants | Armenia | 3.3 /100 | #227 | Tragic 10.0% |