Macedonian vs Immigrants from France Family Poverty
COMPARE
Macedonian
Immigrants from France
Family Poverty
Family Poverty Comparison
Macedonians
Immigrants from France
7.8%
FAMILY POVERTY
98.6/ 100
METRIC RATING
62nd/ 347
METRIC RANK
8.2%
FAMILY POVERTY
94.4/ 100
METRIC RATING
112th/ 347
METRIC RANK
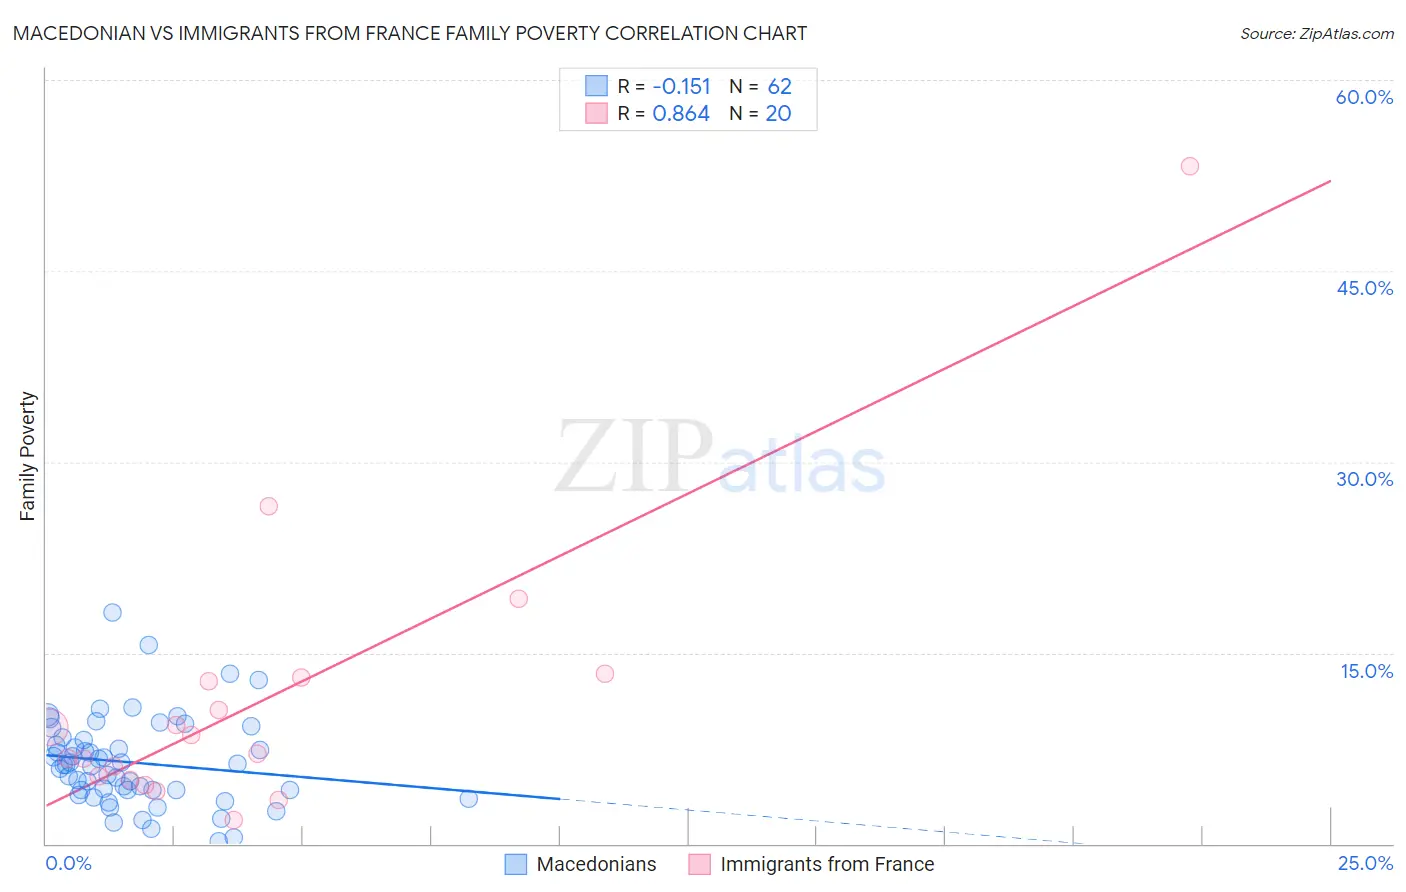
Macedonian vs Immigrants from France Family Poverty Correlation Chart
The statistical analysis conducted on geographies consisting of 132,470,944 people shows a poor negative correlation between the proportion of Macedonians and poverty level among families in the United States with a correlation coefficient (R) of -0.151 and weighted average of 7.8%. Similarly, the statistical analysis conducted on geographies consisting of 287,357,528 people shows a very strong positive correlation between the proportion of Immigrants from France and poverty level among families in the United States with a correlation coefficient (R) of 0.864 and weighted average of 8.2%, a difference of 5.3%.
Family Poverty Correlation Summary
| Measurement | Macedonian | Immigrants from France |
| Minimum | 0.19% | 1.9% |
| Maximum | 18.1% | 53.2% |
| Range | 17.9% | 51.3% |
| Mean | 6.4% | 11.3% |
| Median | 6.2% | 7.8% |
| Interquartile 25% (IQ1) | 4.2% | 5.2% |
| Interquartile 75% (IQ3) | 8.1% | 12.9% |
| Interquartile Range (IQR) | 3.9% | 7.7% |
| Standard Deviation (Sample) | 3.5% | 11.4% |
| Standard Deviation (Population) | 3.4% | 11.1% |
Similar Demographics by Family Poverty
Demographics Similar to Macedonians by Family Poverty
In terms of family poverty, the demographic groups most similar to Macedonians are Immigrants from Netherlands (7.7%, a difference of 0.19%), Immigrants from Greece (7.7%, a difference of 0.37%), European (7.7%, a difference of 0.38%), Finnish (7.7%, a difference of 0.39%), and Asian (7.7%, a difference of 0.42%).
| Demographics | Rating | Rank | Family Poverty |
| Immigrants | Eastern Asia | 98.7 /100 | #55 | Exceptional 7.7% |
| Immigrants | Serbia | 98.7 /100 | #56 | Exceptional 7.7% |
| Asians | 98.7 /100 | #57 | Exceptional 7.7% |
| Finns | 98.7 /100 | #58 | Exceptional 7.7% |
| Europeans | 98.7 /100 | #59 | Exceptional 7.7% |
| Immigrants | Greece | 98.7 /100 | #60 | Exceptional 7.7% |
| Immigrants | Netherlands | 98.6 /100 | #61 | Exceptional 7.7% |
| Macedonians | 98.6 /100 | #62 | Exceptional 7.8% |
| Zimbabweans | 98.4 /100 | #63 | Exceptional 7.8% |
| Koreans | 98.3 /100 | #64 | Exceptional 7.8% |
| Immigrants | Bulgaria | 98.3 /100 | #65 | Exceptional 7.8% |
| Dutch | 98.3 /100 | #66 | Exceptional 7.8% |
| Northern Europeans | 98.3 /100 | #67 | Exceptional 7.8% |
| Australians | 98.2 /100 | #68 | Exceptional 7.8% |
| Immigrants | Belgium | 98.2 /100 | #69 | Exceptional 7.8% |
Demographics Similar to Immigrants from France by Family Poverty
In terms of family poverty, the demographic groups most similar to Immigrants from France are Taiwanese (8.2%, a difference of 0.11%), Romanian (8.2%, a difference of 0.16%), Canadian (8.2%, a difference of 0.17%), Jordanian (8.2%, a difference of 0.25%), and Immigrants from Zimbabwe (8.2%, a difference of 0.26%).
| Demographics | Rating | Rank | Family Poverty |
| Laotians | 95.6 /100 | #105 | Exceptional 8.1% |
| Egyptians | 95.1 /100 | #106 | Exceptional 8.1% |
| French Canadians | 95.0 /100 | #107 | Exceptional 8.1% |
| Basques | 94.9 /100 | #108 | Exceptional 8.1% |
| Jordanians | 94.8 /100 | #109 | Exceptional 8.2% |
| Romanians | 94.7 /100 | #110 | Exceptional 8.2% |
| Taiwanese | 94.6 /100 | #111 | Exceptional 8.2% |
| Immigrants | France | 94.4 /100 | #112 | Exceptional 8.2% |
| Canadians | 94.2 /100 | #113 | Exceptional 8.2% |
| Immigrants | Zimbabwe | 94.0 /100 | #114 | Exceptional 8.2% |
| Immigrants | Israel | 93.5 /100 | #115 | Exceptional 8.2% |
| South Africans | 93.4 /100 | #116 | Exceptional 8.2% |
| Immigrants | Russia | 93.2 /100 | #117 | Exceptional 8.2% |
| Immigrants | Western Europe | 92.9 /100 | #118 | Exceptional 8.2% |
| French | 92.8 /100 | #119 | Exceptional 8.3% |