Macedonian vs Fijian Male Poverty
COMPARE
Macedonian
Fijian
Male Poverty
Male Poverty Comparison
Macedonians
Fijians
9.7%
MALE POVERTY
99.5/ 100
METRIC RATING
32nd/ 347
METRIC RANK
12.6%
MALE POVERTY
0.6/ 100
METRIC RATING
233rd/ 347
METRIC RANK
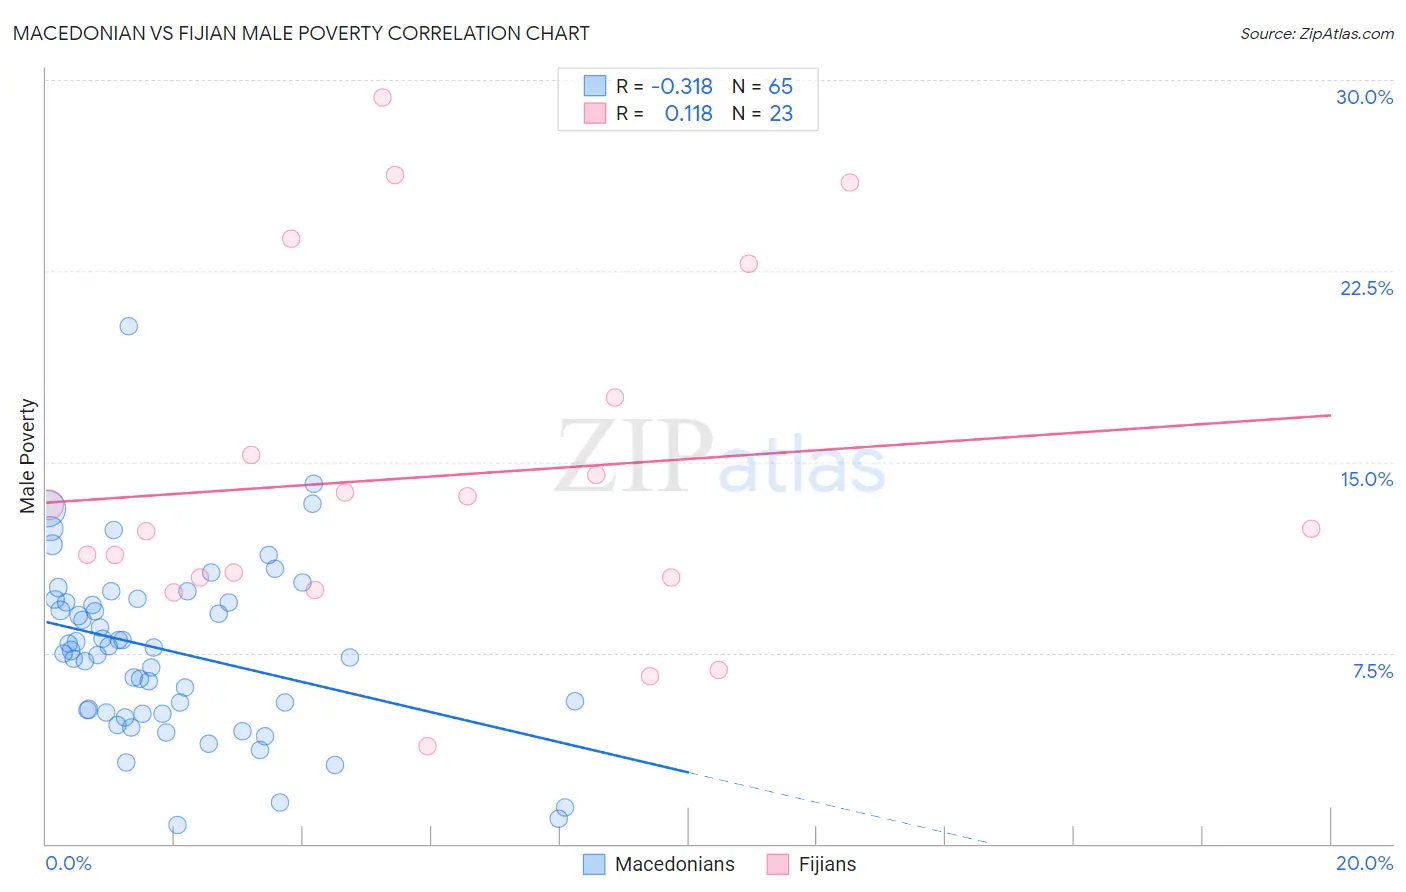
Macedonian vs Fijian Male Poverty Correlation Chart
The statistical analysis conducted on geographies consisting of 132,583,851 people shows a mild negative correlation between the proportion of Macedonians and poverty level among males in the United States with a correlation coefficient (R) of -0.318 and weighted average of 9.7%. Similarly, the statistical analysis conducted on geographies consisting of 55,945,809 people shows a poor positive correlation between the proportion of Fijians and poverty level among males in the United States with a correlation coefficient (R) of 0.118 and weighted average of 12.6%, a difference of 29.3%.
Male Poverty Correlation Summary
| Measurement | Macedonian | Fijian |
| Minimum | 0.75% | 3.8% |
| Maximum | 20.3% | 29.3% |
| Range | 19.6% | 25.4% |
| Mean | 7.6% | 14.4% |
| Median | 7.6% | 12.4% |
| Interquartile 25% (IQ1) | 5.1% | 10.4% |
| Interquartile 75% (IQ3) | 9.5% | 17.5% |
| Interquartile Range (IQR) | 4.4% | 7.1% |
| Standard Deviation (Sample) | 3.4% | 6.8% |
| Standard Deviation (Population) | 3.4% | 6.6% |
Similar Demographics by Male Poverty
Demographics Similar to Macedonians by Male Poverty
In terms of male poverty, the demographic groups most similar to Macedonians are Immigrants from Northern Europe (9.7%, a difference of 0.090%), Tongan (9.7%, a difference of 0.21%), Polish (9.7%, a difference of 0.23%), Immigrants from Poland (9.8%, a difference of 0.23%), and Greek (9.7%, a difference of 0.30%).
| Demographics | Rating | Rank | Male Poverty |
| Eastern Europeans | 99.6 /100 | #25 | Exceptional 9.6% |
| Burmese | 99.6 /100 | #26 | Exceptional 9.7% |
| Danes | 99.6 /100 | #27 | Exceptional 9.7% |
| Immigrants | Korea | 99.6 /100 | #28 | Exceptional 9.7% |
| Greeks | 99.6 /100 | #29 | Exceptional 9.7% |
| Poles | 99.5 /100 | #30 | Exceptional 9.7% |
| Tongans | 99.5 /100 | #31 | Exceptional 9.7% |
| Macedonians | 99.5 /100 | #32 | Exceptional 9.7% |
| Immigrants | Northern Europe | 99.5 /100 | #33 | Exceptional 9.7% |
| Immigrants | Poland | 99.5 /100 | #34 | Exceptional 9.8% |
| Iranians | 99.4 /100 | #35 | Exceptional 9.8% |
| Czechs | 99.4 /100 | #36 | Exceptional 9.8% |
| Immigrants | Greece | 99.3 /100 | #37 | Exceptional 9.8% |
| Immigrants | Pakistan | 99.2 /100 | #38 | Exceptional 9.9% |
| Russians | 99.2 /100 | #39 | Exceptional 9.9% |
Demographics Similar to Fijians by Male Poverty
In terms of male poverty, the demographic groups most similar to Fijians are Nicaraguan (12.6%, a difference of 0.050%), Immigrants from Armenia (12.6%, a difference of 0.060%), Salvadoran (12.6%, a difference of 0.16%), Immigrants from Laos (12.6%, a difference of 0.43%), and Immigrants from Saudi Arabia (12.7%, a difference of 0.68%).
| Demographics | Rating | Rank | Male Poverty |
| Nigerians | 1.4 /100 | #226 | Tragic 12.3% |
| Alaska Natives | 1.4 /100 | #227 | Tragic 12.4% |
| Alsatians | 1.3 /100 | #228 | Tragic 12.4% |
| Cubans | 1.3 /100 | #229 | Tragic 12.4% |
| Marshallese | 0.8 /100 | #230 | Tragic 12.5% |
| Salvadorans | 0.6 /100 | #231 | Tragic 12.6% |
| Nicaraguans | 0.6 /100 | #232 | Tragic 12.6% |
| Fijians | 0.6 /100 | #233 | Tragic 12.6% |
| Immigrants | Armenia | 0.6 /100 | #234 | Tragic 12.6% |
| Immigrants | Laos | 0.5 /100 | #235 | Tragic 12.6% |
| Immigrants | Saudi Arabia | 0.4 /100 | #236 | Tragic 12.7% |
| French American Indians | 0.4 /100 | #237 | Tragic 12.7% |
| Ecuadorians | 0.4 /100 | #238 | Tragic 12.7% |
| Ghanaians | 0.4 /100 | #239 | Tragic 12.7% |
| Immigrants | Middle Africa | 0.4 /100 | #240 | Tragic 12.7% |