Luxembourger vs Immigrants from Thailand Child Poverty Among Boys Under 16
COMPARE
Luxembourger
Immigrants from Thailand
Child Poverty Among Boys Under 16
Child Poverty Among Boys Under 16 Comparison
Luxembourgers
Immigrants from Thailand
13.8%
CHILD POVERTY AMONG BOYS UNDER 16
99.7/ 100
METRIC RATING
36th/ 347
METRIC RANK
17.5%
CHILD POVERTY AMONG BOYS UNDER 16
8.2/ 100
METRIC RATING
207th/ 347
METRIC RANK
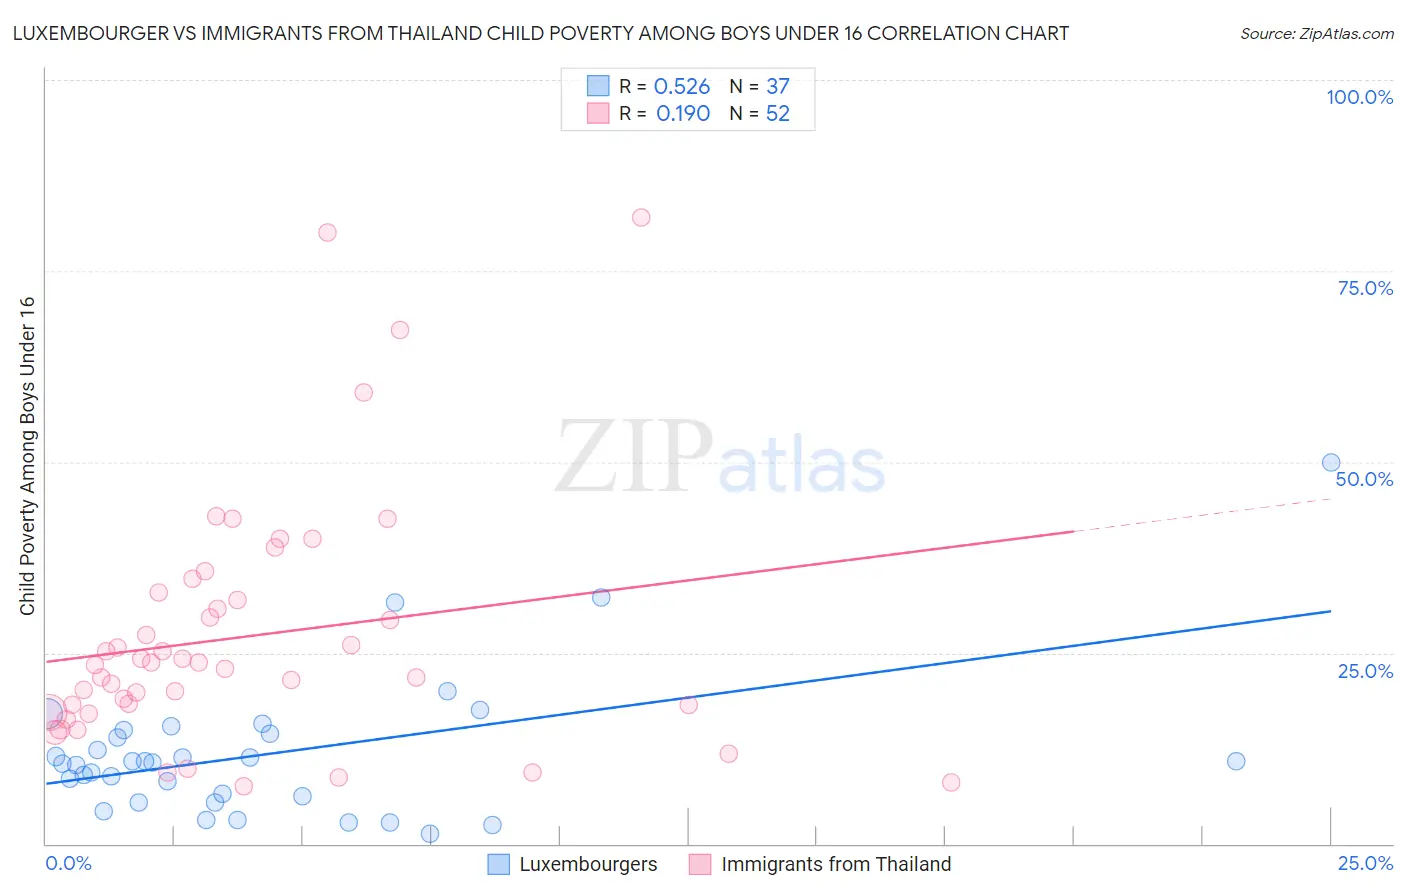
Luxembourger vs Immigrants from Thailand Child Poverty Among Boys Under 16 Correlation Chart
The statistical analysis conducted on geographies consisting of 143,279,235 people shows a substantial positive correlation between the proportion of Luxembourgers and poverty level among boys under the age of 16 in the United States with a correlation coefficient (R) of 0.526 and weighted average of 13.8%. Similarly, the statistical analysis conducted on geographies consisting of 313,818,452 people shows a poor positive correlation between the proportion of Immigrants from Thailand and poverty level among boys under the age of 16 in the United States with a correlation coefficient (R) of 0.190 and weighted average of 17.5%, a difference of 27.1%.
Child Poverty Among Boys Under 16 Correlation Summary
| Measurement | Luxembourger | Immigrants from Thailand |
| Minimum | 1.3% | 7.6% |
| Maximum | 50.0% | 82.1% |
| Range | 48.7% | 74.5% |
| Mean | 11.9% | 27.1% |
| Median | 10.7% | 23.5% |
| Interquartile 25% (IQ1) | 5.8% | 17.7% |
| Interquartile 75% (IQ3) | 14.7% | 32.4% |
| Interquartile Range (IQR) | 8.9% | 14.7% |
| Standard Deviation (Sample) | 9.4% | 16.3% |
| Standard Deviation (Population) | 9.3% | 16.1% |
Similar Demographics by Child Poverty Among Boys Under 16
Demographics Similar to Luxembourgers by Child Poverty Among Boys Under 16
In terms of child poverty among boys under 16, the demographic groups most similar to Luxembourgers are Russian (13.8%, a difference of 0.27%), Immigrants from Sri Lanka (13.9%, a difference of 0.41%), Immigrants from Northern Europe (13.9%, a difference of 0.56%), Immigrants from Australia (13.9%, a difference of 0.70%), and Immigrants from Asia (13.9%, a difference of 0.94%).
| Demographics | Rating | Rank | Child Poverty Among Boys Under 16 |
| Cypriots | 99.8 /100 | #29 | Exceptional 13.6% |
| Swedes | 99.8 /100 | #30 | Exceptional 13.6% |
| Turks | 99.8 /100 | #31 | Exceptional 13.6% |
| Immigrants | China | 99.8 /100 | #32 | Exceptional 13.6% |
| Danes | 99.8 /100 | #33 | Exceptional 13.6% |
| Assyrians/Chaldeans/Syriacs | 99.8 /100 | #34 | Exceptional 13.6% |
| Russians | 99.7 /100 | #35 | Exceptional 13.8% |
| Luxembourgers | 99.7 /100 | #36 | Exceptional 13.8% |
| Immigrants | Sri Lanka | 99.6 /100 | #37 | Exceptional 13.9% |
| Immigrants | Northern Europe | 99.6 /100 | #38 | Exceptional 13.9% |
| Immigrants | Australia | 99.6 /100 | #39 | Exceptional 13.9% |
| Immigrants | Asia | 99.6 /100 | #40 | Exceptional 13.9% |
| Lithuanians | 99.6 /100 | #41 | Exceptional 14.0% |
| Koreans | 99.6 /100 | #42 | Exceptional 14.0% |
| Croatians | 99.5 /100 | #43 | Exceptional 14.0% |
Demographics Similar to Immigrants from Thailand by Child Poverty Among Boys Under 16
In terms of child poverty among boys under 16, the demographic groups most similar to Immigrants from Thailand are Malaysian (17.6%, a difference of 0.22%), Alaskan Athabascan (17.6%, a difference of 0.32%), Immigrants from Armenia (17.6%, a difference of 0.50%), Immigrants (17.6%, a difference of 0.56%), and Aleut (17.7%, a difference of 0.61%).
| Demographics | Rating | Rank | Child Poverty Among Boys Under 16 |
| Immigrants | Uruguay | 16.9 /100 | #200 | Poor 17.2% |
| Immigrants | Afghanistan | 13.7 /100 | #201 | Poor 17.3% |
| Immigrants | Sierra Leone | 13.4 /100 | #202 | Poor 17.3% |
| Immigrants | Uzbekistan | 13.3 /100 | #203 | Poor 17.3% |
| Ugandans | 12.5 /100 | #204 | Poor 17.3% |
| Immigrants | Portugal | 11.2 /100 | #205 | Poor 17.4% |
| German Russians | 10.9 /100 | #206 | Poor 17.4% |
| Immigrants | Thailand | 8.2 /100 | #207 | Tragic 17.5% |
| Malaysians | 7.6 /100 | #208 | Tragic 17.6% |
| Alaskan Athabascans | 7.3 /100 | #209 | Tragic 17.6% |
| Immigrants | Armenia | 6.8 /100 | #210 | Tragic 17.6% |
| Immigrants | Immigrants | 6.7 /100 | #211 | Tragic 17.6% |
| Aleuts | 6.6 /100 | #212 | Tragic 17.7% |
| Immigrants | Eastern Africa | 6.0 /100 | #213 | Tragic 17.7% |
| Panamanians | 5.9 /100 | #214 | Tragic 17.7% |