Luxembourger vs Immigrants from Armenia Child Poverty Under the Age of 16

COMPARE

Luxembourger
Race
Ancestry
AfghanAfricanAlaska NativeAlaskan AthabascanAlbanianAleutAlsatianAmericanApacheArabArapahoArgentineanArmenianAssyrian/Chaldean/SyriacAustralianAustrianBahamianBangladeshiBarbadianBasqueBelgianBelizeanBermudanBhutaneseBlackfeetBolivianBrazilianBritishBritish West IndianBulgarianBurmeseCajunCambodianCanadianCape VerdeanCarpatho RusynCelticCentral AmericanCentral American IndianCherokeeCheyenneChickasawChileanChineseChippewaChoctawColombianColvilleComancheCosta RicanCreeCreekCroatianCrowCubanCypriotCzechCzechoslovakianDanishDelawareDominicanDutchDutch West IndianEastern EuropeanEcuadorianEgyptianEnglishEstonianEthiopianEuropeanFijianFilipinoFinnishFrenchFrench American IndianFrench CanadianGermanGerman RussianGhanaianGreekGuamanian/ChamorroGuatemalanGuyaneseHaitianHmongHonduranHopiHoumaHungarianIcelanderIndian (Asian)IndonesianInupiatIranianIraqiIrishIroquoisIsraeliItalianJamaicanJapaneseJordanianKenyanKiowaKoreanLaotianLatvianLebaneseLiberianLithuanianLumbeeLuxembourgerMacedonianMalaysianMalteseMarshalleseMenomineeMexicanMexican American IndianMongolianMoroccanNative HawaiianNavajoNepaleseNew ZealanderNicaraguanNigerianNorthern EuropeanNorwegianOkinawanOsageOttawaPaiutePakistaniPalestinianPanamanianParaguayanPennsylvania GermanPeruvianPimaPolishPortuguesePotawatomiPuebloPuerto RicanPuget Sound SalishRomanianRussianSalvadoranSamoanScandinavianScotch-IrishScottishSeminoleSenegaleseSerbianShoshoneSierra LeoneanSiouxSlavicSlovakSloveneSomaliSouth AfricanSouth AmericanSouth American IndianSoviet UnionSpaniardSpanishSpanish AmericanSpanish American IndianSri LankanSubsaharan AfricanSudaneseSwedishSwissSyrianTaiwaneseThaiTlingit-HaidaTohono O'OdhamTonganTrinidadian and TobagonianTsimshianTurkishU.S. Virgin IslanderUgandanUkrainianUruguayanUteVenezuelanVietnameseWelshWest IndianYakamaYaquiYugoslavianYumanYup'ikZimbabwean
Immigration
NonimmigrantsImmigrantsAfghanistanAfricaAlbaniaArgentinaAsiaAustraliaAustriaBahamasBangladeshBarbadosBelarusBelgiumBelizeBoliviaBosnia and HerzegovinaBrazilBulgariaBurma/MyanmarCabo VerdeCambodiaCameroonCanadaCaribbeanCentral AmericaChileChinaColombiaCongoCosta RicaCroatiaCubaCzechoslovakiaDenmarkDominicaDominican RepublicEastern AfricaEastern AsiaEastern EuropeEcuadorEgyptEl SalvadorEnglandEritreaEthiopiaEuropeFijiFranceGermanyGhanaGreeceGrenadaGuatemalaGuyanaHaitiHondurasHong KongHungaryIndiaIndonesiaIranIraqIrelandIsraelItalyJamaicaJapanJordanKazakhstanKenyaKoreaKuwaitLaosLatin AmericaLatviaLebanonLiberiaLithuaniaMalaysiaMexicoMicronesiaMiddle AfricaMoldovaMoroccoNepalNetherlandsNicaraguaNigeriaNorth AmericaNorth MacedoniaNorthern AfricaNorthern EuropeNorwayOceaniaPakistanPanamaPeruPhilippinesPolandPortugalRomaniaRussiaSaudi ArabiaScotlandSenegalSerbiaSierra LeoneSingaporeSomaliaSouth AfricaSouth AmericaSouth Central AsiaSouth Eastern AsiaSouthern EuropeSpainSri LankaSt. Vincent and the GrenadinesSudanSwedenSwitzerlandSyriaTaiwanThailandTrinidad and TobagoTurkeyUgandaUkraineUruguayUzbekistanVenezuelaVietnamWest IndiesWestern AfricaWestern AsiaWestern EuropeYemenZaireZimbabweAzores
Immigrants from Armenia
Race
Ancestry
AfghanAfricanAlaska NativeAlaskan AthabascanAlbanianAleutAlsatianAmericanApacheArabArapahoArgentineanArmenianAssyrian/Chaldean/SyriacAustralianAustrianBahamianBangladeshiBarbadianBasqueBelgianBelizeanBermudanBhutaneseBlackfeetBolivianBrazilianBritishBritish West IndianBulgarianBurmeseCajunCambodianCanadianCape VerdeanCarpatho RusynCelticCentral AmericanCentral American IndianCherokeeCheyenneChickasawChileanChineseChippewaChoctawColombianColvilleComancheCosta RicanCreeCreekCroatianCrowCubanCypriotCzechCzechoslovakianDanishDelawareDominicanDutchDutch West IndianEastern EuropeanEcuadorianEgyptianEnglishEstonianEthiopianEuropeanFijianFilipinoFinnishFrenchFrench American IndianFrench CanadianGermanGerman RussianGhanaianGreekGuamanian/ChamorroGuatemalanGuyaneseHaitianHmongHonduranHopiHoumaHungarianIcelanderIndian (Asian)IndonesianInupiatIranianIraqiIrishIroquoisIsraeliItalianJamaicanJapaneseJordanianKenyanKiowaKoreanLaotianLatvianLebaneseLiberianLithuanianLumbeeMacedonianMalaysianMalteseMarshalleseMenomineeMexicanMexican American IndianMongolianMoroccanNative HawaiianNavajoNepaleseNew ZealanderNicaraguanNigerianNorthern EuropeanNorwegianOkinawanOsageOttawaPaiutePakistaniPalestinianPanamanianParaguayanPennsylvania GermanPeruvianPimaPolishPortuguesePotawatomiPuebloPuerto RicanPuget Sound SalishRomanianRussianSalvadoranSamoanScandinavianScotch-IrishScottishSeminoleSenegaleseSerbianShoshoneSierra LeoneanSiouxSlavicSlovakSloveneSomaliSouth AfricanSouth AmericanSouth American IndianSoviet UnionSpaniardSpanishSpanish AmericanSpanish American IndianSri LankanSubsaharan AfricanSudaneseSwedishSwissSyrianTaiwaneseThaiTlingit-HaidaTohono O'OdhamTonganTrinidadian and TobagonianTsimshianTurkishU.S. Virgin IslanderUgandanUkrainianUruguayanUteVenezuelanVietnameseWelshWest IndianYakamaYaquiYugoslavianYumanYup'ikZimbabwean
Immigration
NonimmigrantsImmigrantsAfghanistanAfricaAlbaniaArgentinaArmeniaAsiaAustraliaAustriaBahamasBangladeshBarbadosBelarusBelgiumBelizeBoliviaBosnia and HerzegovinaBrazilBulgariaBurma/MyanmarCabo VerdeCambodiaCameroonCanadaCaribbeanCentral AmericaChileChinaColombiaCongoCosta RicaCroatiaCubaCzechoslovakiaDenmarkDominicaDominican RepublicEastern AfricaEastern AsiaEastern EuropeEcuadorEgyptEl SalvadorEnglandEritreaEthiopiaEuropeFijiFranceGermanyGhanaGreeceGrenadaGuatemalaGuyanaHaitiHondurasHong KongHungaryIndiaIndonesiaIranIraqIrelandIsraelItalyJamaicaJapanJordanKazakhstanKenyaKoreaKuwaitLaosLatin AmericaLatviaLebanonLiberiaLithuaniaMalaysiaMexicoMicronesiaMiddle AfricaMoldovaMoroccoNepalNetherlandsNicaraguaNigeriaNorth AmericaNorth MacedoniaNorthern AfricaNorthern EuropeNorwayOceaniaPakistanPanamaPeruPhilippinesPolandPortugalRomaniaRussiaSaudi ArabiaScotlandSenegalSerbiaSierra LeoneSingaporeSomaliaSouth AfricaSouth AmericaSouth Central AsiaSouth Eastern AsiaSouthern EuropeSpainSri LankaSt. Vincent and the GrenadinesSudanSwedenSwitzerlandSyriaTaiwanThailandTrinidad and TobagoTurkeyUgandaUkraineUruguayUzbekistanVenezuelaVietnamWest IndiesWestern AfricaWestern AsiaWestern EuropeYemenZaireZimbabweAzores
Child Poverty Under the Age of 16
Income
Poverty
Unemployment
Labor Participation
Family Structure
Vehicle Availability
Education Level
Disability

Child Poverty Under the Age of 16 Comparison

Luxembourgers

Immigrants from Armenia

Exceptional
Tragic
13.6%
CHILD POVERTY UNDER THE AGE OF 16
99.5/ 100
METRIC RATING
38th/ 347
METRIC RANK
17.8%
CHILD POVERTY UNDER THE AGE OF 16
3.6/ 100
METRIC RATING
222nd/ 347
METRIC RANK

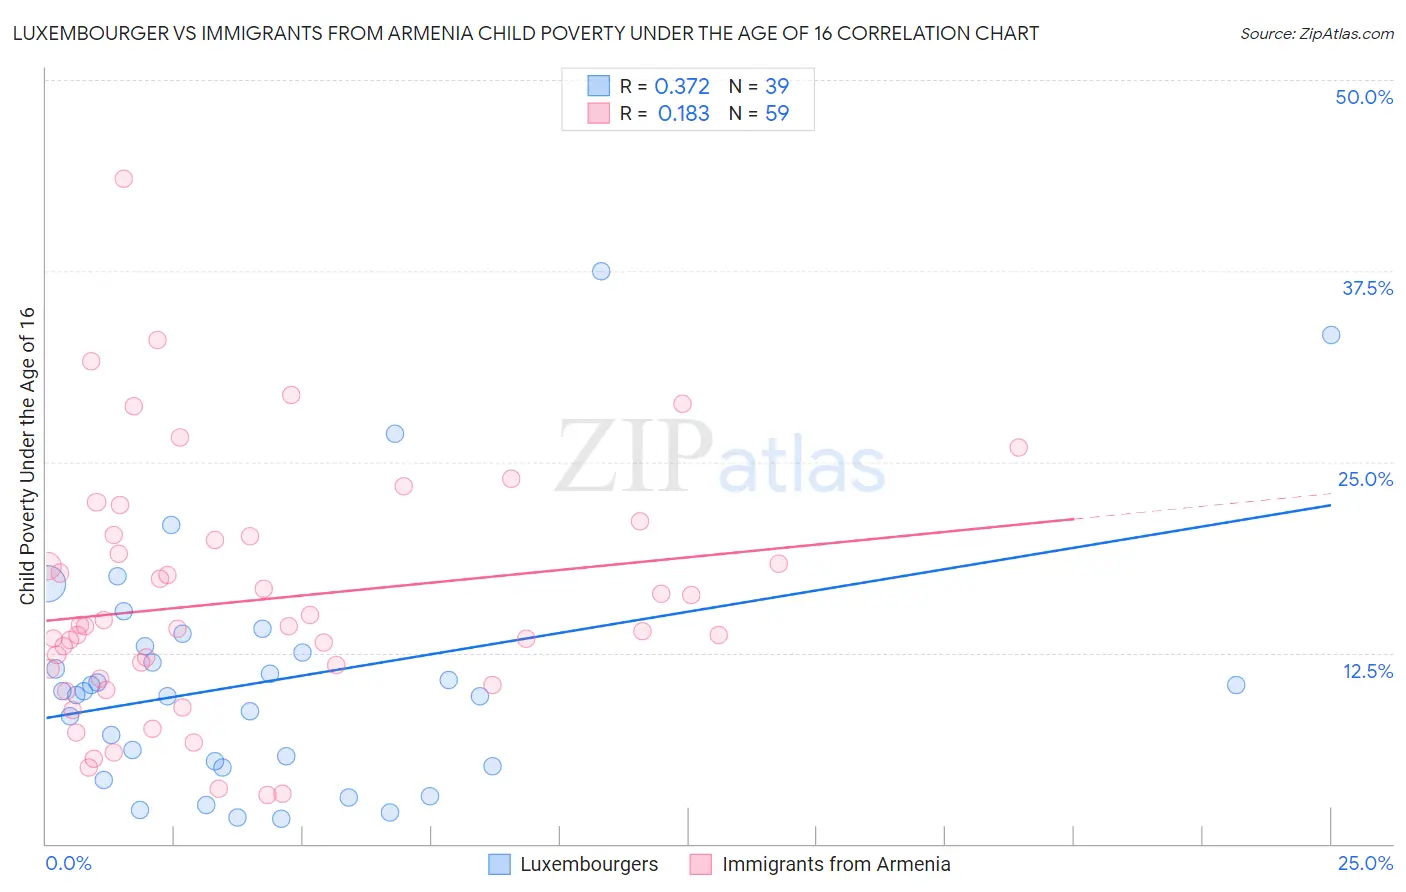
Luxembourger vs Immigrants from Armenia Child Poverty Under the Age of 16 Correlation Chart

The statistical analysis conducted on geographies consisting of 143,837,676 people shows a mild positive correlation between the proportion of Luxembourgers and poverty level among children under the age of 16 in the United States with a correlation coefficient (R) of 0.372 and weighted average of 13.6%. Similarly, the statistical analysis conducted on geographies consisting of 97,394,858 people shows a poor positive correlation between the proportion of Immigrants from Armenia and poverty level among children under the age of 16 in the United States with a correlation coefficient (R) of 0.183 and weighted average of 17.8%, a difference of 30.5%.
Luxembourger vs Immigrants from Armenia Child Poverty Under the Age of 16

Child Poverty Under the Age of 16 Correlation Summary

MeasurementLuxembourgerImmigrants from Armenia
Minimum1.6%3.2%
Maximum37.5%43.5%
Range35.9%40.3%
Mean10.7%15.9%
Median10.0%14.2%
Interquartile 25% (IQ1)5.1%10.8%
Interquartile 75% (IQ3)13.0%20.1%
Interquartile Range (IQR)7.9%9.3%
Standard Deviation (Sample)8.0%8.0%
Standard Deviation (Population)7.9%8.0%

Similar Demographics by Child Poverty Under the Age of 16

Demographics Similar to Luxembourgers by Child Poverty Under the Age of 16

In terms of child poverty under the age of 16, the demographic groups most similar to Luxembourgers are Immigrants from Australia (13.6%, a difference of 0.020%), Immigrants from Bolivia (13.6%, a difference of 0.51%), Immigrants from Northern Europe (13.6%, a difference of 0.52%), Immigrants from Scotland (13.7%, a difference of 0.71%), and Lithuanian (13.5%, a difference of 0.77%).
DemographicsRating | RankChild Poverty Under the Age of 16
Danes
99.7
/100
|
#31
Exceptional
13.4%
Tongans
99.7
/100
|
#32
Exceptional
13.4%
Asians
99.6
/100
|
#33
Exceptional
13.5%
Russians
99.6
/100
|
#34
Exceptional
13.5%
Lithuanians
99.6
/100
|
#35
Exceptional
13.5%
Immigrants | Northern Europe
99.6
/100
|
#36
Exceptional
13.6%
Immigrants | Bolivia
99.6
/100
|
#37
Exceptional
13.6%
Luxembourgers
99.5
/100
|
#38
Exceptional
13.6%
Immigrants | Australia
99.5
/100
|
#39
Exceptional
13.6%
Immigrants | Scotland
99.4
/100
|
#40
Exceptional
13.7%
Croatians
99.4
/100
|
#41
Exceptional
13.8%
Immigrants | Sri Lanka
99.3
/100
|
#42
Exceptional
13.8%
Immigrants | Moldova
99.3
/100
|
#43
Exceptional
13.8%
Greeks
99.3
/100
|
#44
Exceptional
13.8%
Czechs
99.3
/100
|
#45
Exceptional
13.8%

Demographics Similar to Immigrants from Armenia by Child Poverty Under the Age of 16

In terms of child poverty under the age of 16, the demographic groups most similar to Immigrants from Armenia are Cuban (17.8%, a difference of 0.060%), Immigrants from Cambodia (17.8%, a difference of 0.24%), Immigrants from Panama (17.7%, a difference of 0.33%), Osage (17.9%, a difference of 0.47%), and Japanese (17.7%, a difference of 0.74%).
DemographicsRating | RankChild Poverty Under the Age of 16
Malaysians
5.9
/100
|
#215
Tragic
17.5%
Sierra Leoneans
5.7
/100
|
#216
Tragic
17.6%
Immigrants | Eastern Africa
5.3
/100
|
#217
Tragic
17.6%
Moroccans
5.3
/100
|
#218
Tragic
17.6%
Japanese
4.7
/100
|
#219
Tragic
17.7%
Immigrants | Panama
4.1
/100
|
#220
Tragic
17.7%
Cubans
3.7
/100
|
#221
Tragic
17.8%
Immigrants | Armenia
3.6
/100
|
#222
Tragic
17.8%
Immigrants | Cambodia
3.3
/100
|
#223
Tragic
17.8%
Osage
3.1
/100
|
#224
Tragic
17.9%
Immigrants | Nonimmigrants
2.7
/100
|
#225
Tragic
17.9%
Bermudans
2.6
/100
|
#226
Tragic
18.0%
Immigrants | Africa
2.5
/100
|
#227
Tragic
18.0%
Immigrants | Micronesia
2.3
/100
|
#228
Tragic
18.0%
Marshallese
1.8
/100
|
#229
Tragic
18.1%