Lumbee vs West Indian Female Poverty Among 18-24 Year Olds
COMPARE
Lumbee
West Indian
Female Poverty Among 18-24 Year Olds
Female Poverty Among 18-24 Year Olds Comparison
Lumbee
West Indians
31.1%
FEMALE POVERTY AMONG 18-24 YEAR OLDS
0.0/ 100
METRIC RATING
346th/ 347
METRIC RANK
21.1%
FEMALE POVERTY AMONG 18-24 YEAR OLDS
1.9/ 100
METRIC RATING
251st/ 347
METRIC RANK
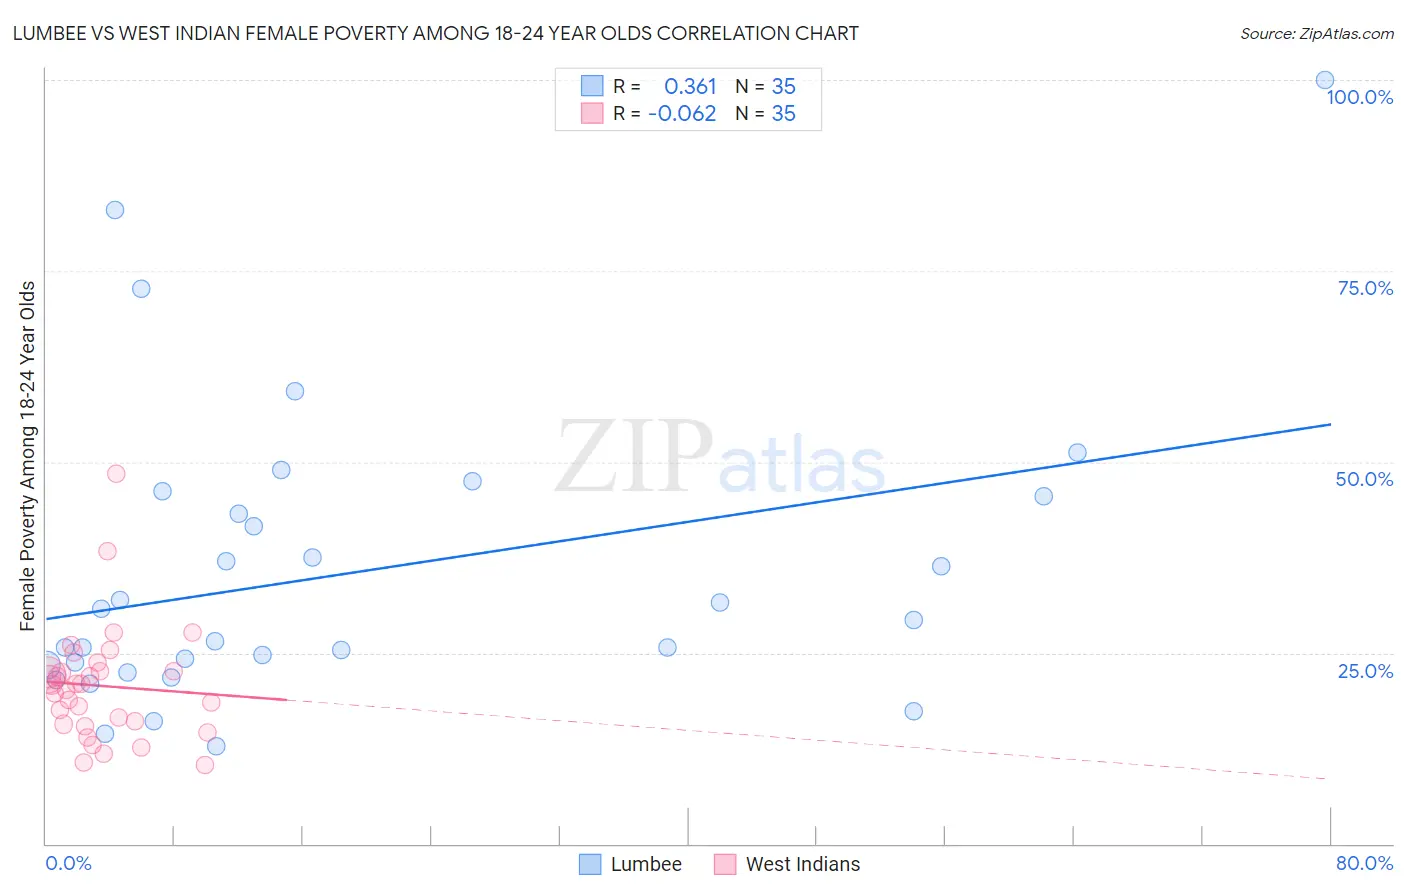
Lumbee vs West Indian Female Poverty Among 18-24 Year Olds Correlation Chart
The statistical analysis conducted on geographies consisting of 91,352,891 people shows a mild positive correlation between the proportion of Lumbee and poverty level among females between the ages 18 and 24 in the United States with a correlation coefficient (R) of 0.361 and weighted average of 31.1%. Similarly, the statistical analysis conducted on geographies consisting of 250,472,705 people shows a slight negative correlation between the proportion of West Indians and poverty level among females between the ages 18 and 24 in the United States with a correlation coefficient (R) of -0.062 and weighted average of 21.1%, a difference of 47.4%.
Female Poverty Among 18-24 Year Olds Correlation Summary
| Measurement | Lumbee | West Indian |
| Minimum | 12.7% | 10.4% |
| Maximum | 100.0% | 48.5% |
| Range | 87.3% | 38.1% |
| Mean | 35.6% | 20.7% |
| Median | 29.3% | 20.8% |
| Interquartile 25% (IQ1) | 23.4% | 15.6% |
| Interquartile 75% (IQ3) | 45.5% | 22.6% |
| Interquartile Range (IQR) | 22.0% | 7.0% |
| Standard Deviation (Sample) | 19.4% | 7.5% |
| Standard Deviation (Population) | 19.1% | 7.4% |
Similar Demographics by Female Poverty Among 18-24 Year Olds
Demographics Similar to Lumbee by Female Poverty Among 18-24 Year Olds
In terms of female poverty among 18-24 year olds, the demographic groups most similar to Lumbee are Tohono O'odham (31.0%, a difference of 0.16%), Navajo (30.3%, a difference of 2.5%), Puerto Rican (29.8%, a difference of 4.1%), Kiowa (29.2%, a difference of 6.2%), and Crow (33.2%, a difference of 7.0%).
| Demographics | Rating | Rank | Female Poverty Among 18-24 Year Olds |
| Apache | 0.0 /100 | #333 | Tragic 26.3% |
| Pueblo | 0.0 /100 | #334 | Tragic 26.9% |
| Yup'ik | 0.0 /100 | #335 | Tragic 27.0% |
| Immigrants | Yemen | 0.0 /100 | #336 | Tragic 27.5% |
| Cheyenne | 0.0 /100 | #337 | Tragic 28.1% |
| Hopi | 0.0 /100 | #338 | Tragic 28.2% |
| Pima | 0.0 /100 | #339 | Tragic 28.4% |
| Sioux | 0.0 /100 | #340 | Tragic 28.6% |
| Colville | 0.0 /100 | #341 | Tragic 29.0% |
| Kiowa | 0.0 /100 | #342 | Tragic 29.2% |
| Puerto Ricans | 0.0 /100 | #343 | Tragic 29.8% |
| Navajo | 0.0 /100 | #344 | Tragic 30.3% |
| Tohono O'odham | 0.0 /100 | #345 | Tragic 31.0% |
| Lumbee | 0.0 /100 | #346 | Tragic 31.1% |
| Crow | 0.0 /100 | #347 | Tragic 33.2% |
Demographics Similar to West Indians by Female Poverty Among 18-24 Year Olds
In terms of female poverty among 18-24 year olds, the demographic groups most similar to West Indians are South African (21.1%, a difference of 0.18%), Immigrants from West Indies (21.0%, a difference of 0.20%), Delaware (21.1%, a difference of 0.23%), Carpatho Rusyn (21.0%, a difference of 0.33%), and Immigrants from Kenya (21.0%, a difference of 0.35%).
| Demographics | Rating | Rank | Female Poverty Among 18-24 Year Olds |
| Immigrants | Thailand | 3.4 /100 | #244 | Tragic 20.9% |
| Aleuts | 3.3 /100 | #245 | Tragic 20.9% |
| Immigrants | Australia | 3.1 /100 | #246 | Tragic 20.9% |
| Immigrants | Africa | 3.0 /100 | #247 | Tragic 21.0% |
| Immigrants | Kenya | 2.5 /100 | #248 | Tragic 21.0% |
| Carpatho Rusyns | 2.5 /100 | #249 | Tragic 21.0% |
| Immigrants | West Indies | 2.2 /100 | #250 | Tragic 21.0% |
| West Indians | 1.9 /100 | #251 | Tragic 21.1% |
| South Africans | 1.6 /100 | #252 | Tragic 21.1% |
| Delaware | 1.6 /100 | #253 | Tragic 21.1% |
| British West Indians | 1.2 /100 | #254 | Tragic 21.2% |
| Immigrants | Grenada | 1.2 /100 | #255 | Tragic 21.2% |
| Tsimshian | 1.0 /100 | #256 | Tragic 21.2% |
| Taiwanese | 1.0 /100 | #257 | Tragic 21.2% |
| Vietnamese | 0.6 /100 | #258 | Tragic 21.4% |