Lumbee vs Immigrants from Zaire Single Father Poverty
COMPARE
Lumbee
Immigrants from Zaire
Single Father Poverty
Single Father Poverty Comparison
Lumbee
Immigrants from Zaire
28.5%
SINGLE FATHER POVERTY
0.0/ 100
METRIC RATING
343rd/ 347
METRIC RANK
17.3%
SINGLE FATHER POVERTY
0.4/ 100
METRIC RATING
262nd/ 347
METRIC RANK
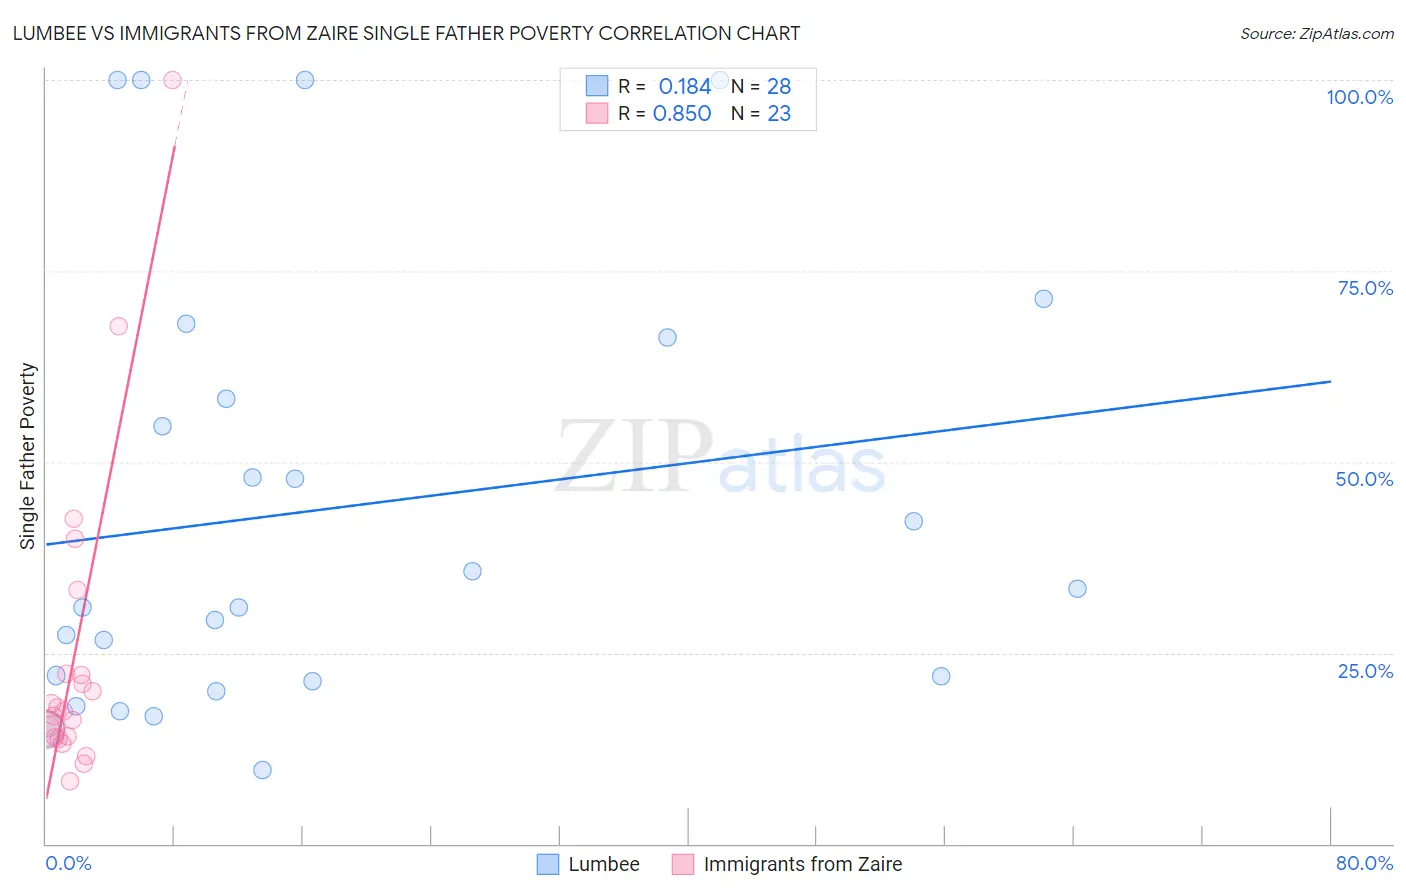
Lumbee vs Immigrants from Zaire Single Father Poverty Correlation Chart
The statistical analysis conducted on geographies consisting of 83,517,726 people shows a poor positive correlation between the proportion of Lumbee and poverty level among single fathers in the United States with a correlation coefficient (R) of 0.184 and weighted average of 28.5%. Similarly, the statistical analysis conducted on geographies consisting of 97,955,340 people shows a very strong positive correlation between the proportion of Immigrants from Zaire and poverty level among single fathers in the United States with a correlation coefficient (R) of 0.850 and weighted average of 17.3%, a difference of 64.8%.
Single Father Poverty Correlation Summary
| Measurement | Lumbee | Immigrants from Zaire |
| Minimum | 9.7% | 8.2% |
| Maximum | 100.0% | 100.0% |
| Range | 90.3% | 91.8% |
| Mean | 44.0% | 24.8% |
| Median | 32.1% | 17.3% |
| Interquartile 25% (IQ1) | 21.6% | 14.0% |
| Interquartile 75% (IQ3) | 62.2% | 22.3% |
| Interquartile Range (IQR) | 40.6% | 8.3% |
| Standard Deviation (Sample) | 28.7% | 21.1% |
| Standard Deviation (Population) | 28.2% | 20.6% |
Similar Demographics by Single Father Poverty
Demographics Similar to Lumbee by Single Father Poverty
In terms of single father poverty, the demographic groups most similar to Lumbee are Yuman (28.4%, a difference of 0.33%), Navajo (29.2%, a difference of 2.6%), Hopi (27.2%, a difference of 4.9%), Crow (30.3%, a difference of 6.3%), and Houma (26.7%, a difference of 6.5%).
| Demographics | Rating | Rank | Single Father Poverty |
| Natives/Alaskans | 0.0 /100 | #333 | Tragic 22.4% |
| Kiowa | 0.0 /100 | #334 | Tragic 22.5% |
| Shoshone | 0.0 /100 | #335 | Tragic 22.9% |
| Cajuns | 0.0 /100 | #336 | Tragic 23.1% |
| Sioux | 0.0 /100 | #337 | Tragic 23.9% |
| Arapaho | 0.0 /100 | #338 | Tragic 24.0% |
| Apache | 0.0 /100 | #339 | Tragic 24.2% |
| Houma | 0.0 /100 | #340 | Tragic 26.7% |
| Hopi | 0.0 /100 | #341 | Tragic 27.2% |
| Yuman | 0.0 /100 | #342 | Tragic 28.4% |
| Lumbee | 0.0 /100 | #343 | Tragic 28.5% |
| Navajo | 0.0 /100 | #344 | Tragic 29.2% |
| Crow | 0.0 /100 | #345 | Tragic 30.3% |
| Puerto Ricans | 0.0 /100 | #346 | Tragic 31.5% |
| Yup'ik | 0.0 /100 | #347 | Tragic 32.5% |
Demographics Similar to Immigrants from Zaire by Single Father Poverty
In terms of single father poverty, the demographic groups most similar to Immigrants from Zaire are Lithuanian (17.3%, a difference of 0.010%), Swiss (17.3%, a difference of 0.13%), Slovene (17.3%, a difference of 0.22%), Polish (17.3%, a difference of 0.22%), and Jamaican (17.3%, a difference of 0.27%).
| Demographics | Rating | Rank | Single Father Poverty |
| Sierra Leoneans | 0.8 /100 | #255 | Tragic 17.2% |
| Immigrants | Haiti | 0.8 /100 | #256 | Tragic 17.2% |
| Immigrants | Albania | 0.7 /100 | #257 | Tragic 17.2% |
| Albanians | 0.7 /100 | #258 | Tragic 17.2% |
| Immigrants | Jamaica | 0.7 /100 | #259 | Tragic 17.2% |
| Spaniards | 0.6 /100 | #260 | Tragic 17.2% |
| Swiss | 0.5 /100 | #261 | Tragic 17.3% |
| Immigrants | Zaire | 0.4 /100 | #262 | Tragic 17.3% |
| Lithuanians | 0.4 /100 | #263 | Tragic 17.3% |
| Slovenes | 0.3 /100 | #264 | Tragic 17.3% |
| Poles | 0.3 /100 | #265 | Tragic 17.3% |
| Jamaicans | 0.3 /100 | #266 | Tragic 17.3% |
| Haitians | 0.3 /100 | #267 | Tragic 17.3% |
| Immigrants | Caribbean | 0.3 /100 | #268 | Tragic 17.4% |
| Slavs | 0.3 /100 | #269 | Tragic 17.4% |