Lumbee vs Comanche Female Poverty Among 25-34 Year Olds
COMPARE
Lumbee
Comanche
Female Poverty Among 25-34 Year Olds
Female Poverty Among 25-34 Year Olds Comparison
Lumbee
Comanche
26.3%
FEMALE POVERTY AMONG 25-34 YEAR OLDS
0.0/ 100
METRIC RATING
346th/ 347
METRIC RANK
16.5%
FEMALE POVERTY AMONG 25-34 YEAR OLDS
0.0/ 100
METRIC RATING
291st/ 347
METRIC RANK
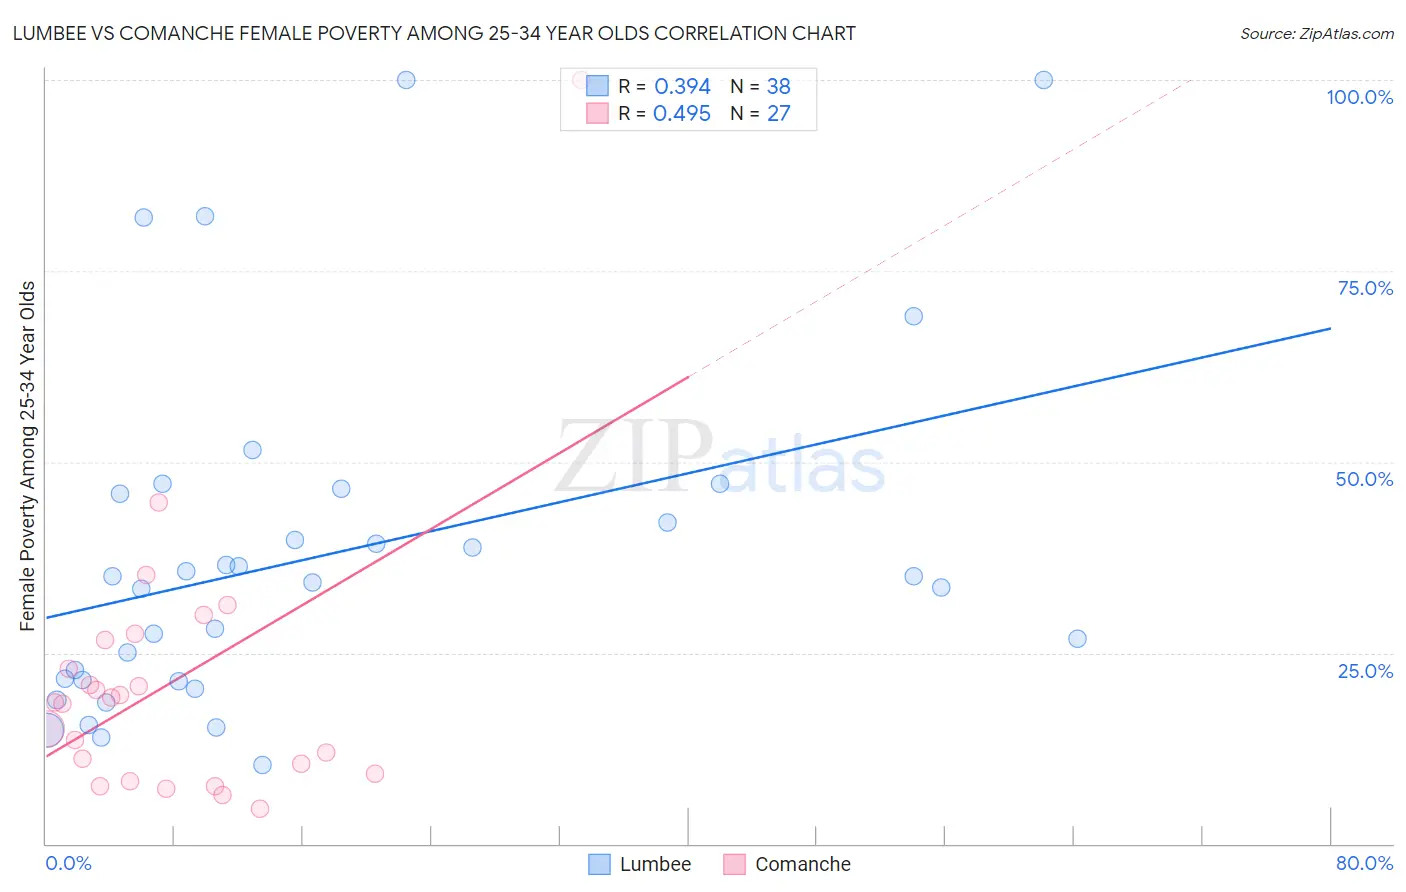
Lumbee vs Comanche Female Poverty Among 25-34 Year Olds Correlation Chart
The statistical analysis conducted on geographies consisting of 91,764,712 people shows a mild positive correlation between the proportion of Lumbee and poverty level among females between the ages 25 and 34 in the United States with a correlation coefficient (R) of 0.394 and weighted average of 26.3%. Similarly, the statistical analysis conducted on geographies consisting of 109,487,317 people shows a moderate positive correlation between the proportion of Comanche and poverty level among females between the ages 25 and 34 in the United States with a correlation coefficient (R) of 0.495 and weighted average of 16.5%, a difference of 59.6%.
Female Poverty Among 25-34 Year Olds Correlation Summary
| Measurement | Lumbee | Comanche |
| Minimum | 10.3% | 4.5% |
| Maximum | 100.0% | 100.0% |
| Range | 89.7% | 95.5% |
| Mean | 37.7% | 21.0% |
| Median | 34.5% | 18.5% |
| Interquartile 25% (IQ1) | 21.5% | 9.1% |
| Interquartile 75% (IQ3) | 45.8% | 26.7% |
| Interquartile Range (IQR) | 24.3% | 17.6% |
| Standard Deviation (Sample) | 22.5% | 18.6% |
| Standard Deviation (Population) | 22.2% | 18.3% |
Similar Demographics by Female Poverty Among 25-34 Year Olds
Demographics Similar to Lumbee by Female Poverty Among 25-34 Year Olds
In terms of female poverty among 25-34 year olds, the demographic groups most similar to Lumbee are Puerto Rican (26.3%, a difference of 0.030%), Pima (25.3%, a difference of 3.9%), Tohono O'odham (24.7%, a difference of 6.2%), Yup'ik (24.3%, a difference of 8.1%), and Hopi (23.7%, a difference of 11.0%).
| Demographics | Rating | Rank | Female Poverty Among 25-34 Year Olds |
| Cajuns | 0.0 /100 | #333 | Tragic 19.9% |
| Apache | 0.0 /100 | #334 | Tragic 20.1% |
| Natives/Alaskans | 0.0 /100 | #335 | Tragic 20.3% |
| Pueblo | 0.0 /100 | #336 | Tragic 22.2% |
| Crow | 0.0 /100 | #337 | Tragic 22.7% |
| Houma | 0.0 /100 | #338 | Tragic 22.7% |
| Yuman | 0.0 /100 | #339 | Tragic 22.9% |
| Sioux | 0.0 /100 | #340 | Tragic 23.0% |
| Navajo | 0.0 /100 | #341 | Tragic 23.3% |
| Hopi | 0.0 /100 | #342 | Tragic 23.7% |
| Yup'ik | 0.0 /100 | #343 | Tragic 24.3% |
| Tohono O'odham | 0.0 /100 | #344 | Tragic 24.7% |
| Pima | 0.0 /100 | #345 | Tragic 25.3% |
| Lumbee | 0.0 /100 | #346 | Tragic 26.3% |
| Puerto Ricans | 0.0 /100 | #347 | Tragic 26.3% |
Demographics Similar to Comanche by Female Poverty Among 25-34 Year Olds
In terms of female poverty among 25-34 year olds, the demographic groups most similar to Comanche are Immigrants from Dominica (16.5%, a difference of 0.010%), Indonesian (16.4%, a difference of 0.28%), Potawatomi (16.5%, a difference of 0.28%), Osage (16.4%, a difference of 0.44%), and Guatemalan (16.4%, a difference of 0.50%).
| Demographics | Rating | Rank | Female Poverty Among 25-34 Year Olds |
| Shoshone | 0.0 /100 | #284 | Tragic 16.2% |
| Immigrants | Bahamas | 0.0 /100 | #285 | Tragic 16.3% |
| Cape Verdeans | 0.0 /100 | #286 | Tragic 16.3% |
| Americans | 0.0 /100 | #287 | Tragic 16.4% |
| Guatemalans | 0.0 /100 | #288 | Tragic 16.4% |
| Osage | 0.0 /100 | #289 | Tragic 16.4% |
| Indonesians | 0.0 /100 | #290 | Tragic 16.4% |
| Comanche | 0.0 /100 | #291 | Tragic 16.5% |
| Immigrants | Dominica | 0.0 /100 | #292 | Tragic 16.5% |
| Potawatomi | 0.0 /100 | #293 | Tragic 16.5% |
| Immigrants | Central America | 0.0 /100 | #294 | Tragic 16.6% |
| Mexicans | 0.0 /100 | #295 | Tragic 16.6% |
| Hispanics or Latinos | 0.0 /100 | #296 | Tragic 16.6% |
| Immigrants | Guatemala | 0.0 /100 | #297 | Tragic 16.6% |
| Blackfeet | 0.0 /100 | #298 | Tragic 16.7% |