Lithuanian vs Immigrants from Senegal Single Father Poverty
COMPARE
Lithuanian
Immigrants from Senegal
Single Father Poverty
Single Father Poverty Comparison
Lithuanians
Immigrants from Senegal
17.3%
SINGLE FATHER POVERTY
0.4/ 100
METRIC RATING
263rd/ 347
METRIC RANK
16.6%
SINGLE FATHER POVERTY
13.7/ 100
METRIC RATING
206th/ 347
METRIC RANK
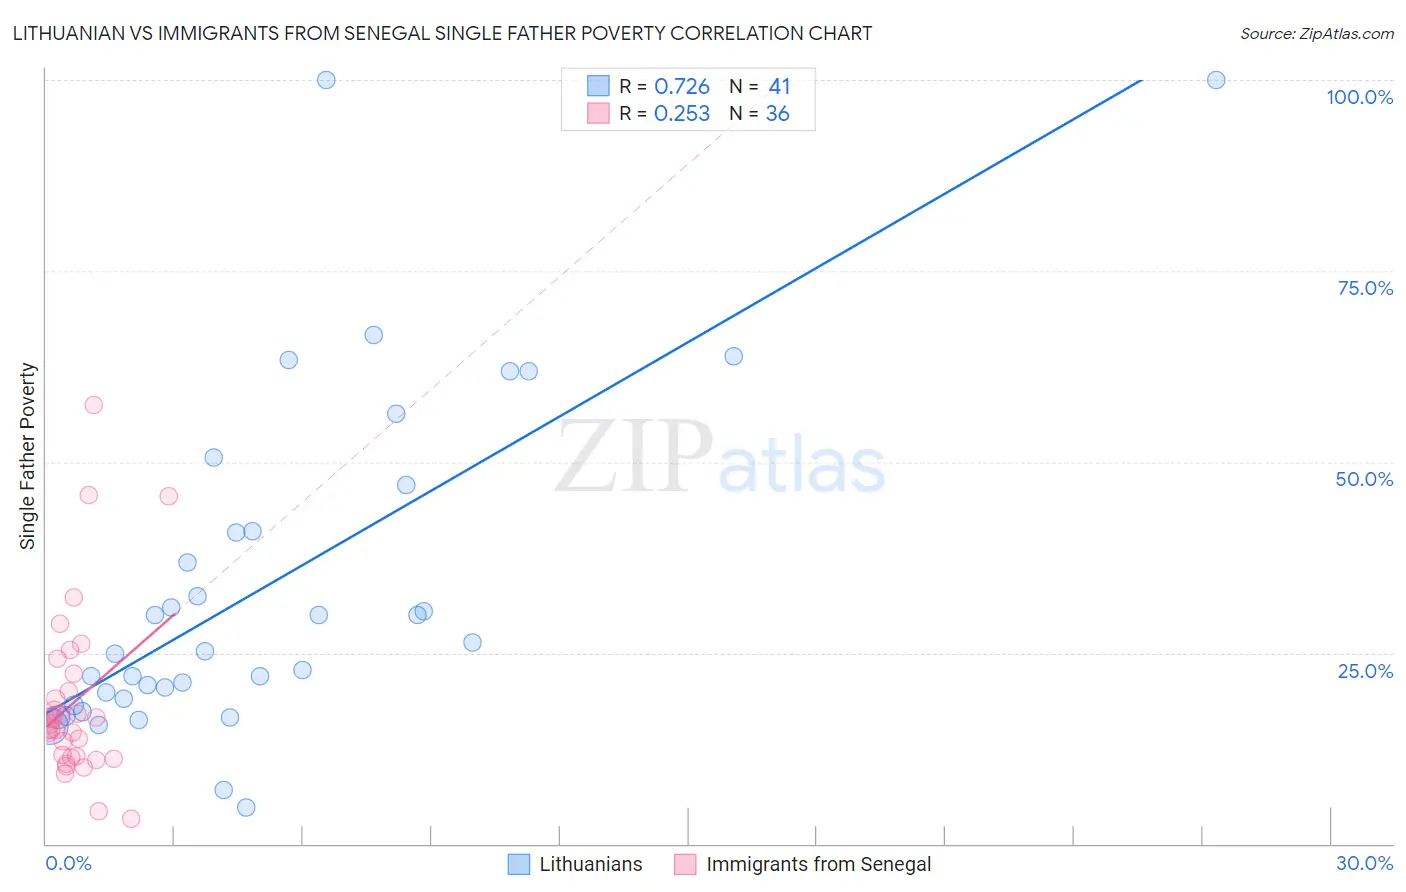
Lithuanian vs Immigrants from Senegal Single Father Poverty Correlation Chart
The statistical analysis conducted on geographies consisting of 319,660,804 people shows a strong positive correlation between the proportion of Lithuanians and poverty level among single fathers in the United States with a correlation coefficient (R) of 0.726 and weighted average of 17.3%. Similarly, the statistical analysis conducted on geographies consisting of 83,824,522 people shows a weak positive correlation between the proportion of Immigrants from Senegal and poverty level among single fathers in the United States with a correlation coefficient (R) of 0.253 and weighted average of 16.6%, a difference of 4.0%.
Single Father Poverty Correlation Summary
| Measurement | Lithuanian | Immigrants from Senegal |
| Minimum | 4.8% | 3.3% |
| Maximum | 100.0% | 57.4% |
| Range | 95.2% | 54.2% |
| Mean | 33.8% | 18.6% |
| Median | 25.2% | 15.4% |
| Interquartile 25% (IQ1) | 18.5% | 11.4% |
| Interquartile 75% (IQ3) | 44.0% | 21.1% |
| Interquartile Range (IQR) | 25.5% | 9.7% |
| Standard Deviation (Sample) | 22.3% | 11.4% |
| Standard Deviation (Population) | 22.1% | 11.3% |
Similar Demographics by Single Father Poverty
Demographics Similar to Lithuanians by Single Father Poverty
In terms of single father poverty, the demographic groups most similar to Lithuanians are Immigrants from Zaire (17.3%, a difference of 0.010%), Swiss (17.3%, a difference of 0.14%), Slovene (17.3%, a difference of 0.20%), Polish (17.3%, a difference of 0.21%), and Jamaican (17.3%, a difference of 0.26%).
| Demographics | Rating | Rank | Single Father Poverty |
| Immigrants | Haiti | 0.8 /100 | #256 | Tragic 17.2% |
| Immigrants | Albania | 0.7 /100 | #257 | Tragic 17.2% |
| Albanians | 0.7 /100 | #258 | Tragic 17.2% |
| Immigrants | Jamaica | 0.7 /100 | #259 | Tragic 17.2% |
| Spaniards | 0.6 /100 | #260 | Tragic 17.2% |
| Swiss | 0.5 /100 | #261 | Tragic 17.3% |
| Immigrants | Zaire | 0.4 /100 | #262 | Tragic 17.3% |
| Lithuanians | 0.4 /100 | #263 | Tragic 17.3% |
| Slovenes | 0.3 /100 | #264 | Tragic 17.3% |
| Poles | 0.3 /100 | #265 | Tragic 17.3% |
| Jamaicans | 0.3 /100 | #266 | Tragic 17.3% |
| Haitians | 0.3 /100 | #267 | Tragic 17.3% |
| Immigrants | Caribbean | 0.3 /100 | #268 | Tragic 17.4% |
| Slavs | 0.3 /100 | #269 | Tragic 17.4% |
| Indonesians | 0.2 /100 | #270 | Tragic 17.4% |
Demographics Similar to Immigrants from Senegal by Single Father Poverty
In terms of single father poverty, the demographic groups most similar to Immigrants from Senegal are New Zealander (16.6%, a difference of 0.0%), Eastern European (16.6%, a difference of 0.0%), Venezuelan (16.6%, a difference of 0.050%), European (16.6%, a difference of 0.050%), and Guatemalan (16.6%, a difference of 0.080%).
| Demographics | Rating | Rank | Single Father Poverty |
| Immigrants | Belize | 19.8 /100 | #199 | Poor 16.5% |
| Syrians | 17.4 /100 | #200 | Poor 16.6% |
| Cubans | 16.5 /100 | #201 | Poor 16.6% |
| Immigrants | Croatia | 16.5 /100 | #202 | Poor 16.6% |
| Immigrants | North America | 15.1 /100 | #203 | Poor 16.6% |
| Immigrants | Guatemala | 14.8 /100 | #204 | Poor 16.6% |
| Venezuelans | 14.3 /100 | #205 | Poor 16.6% |
| Immigrants | Senegal | 13.7 /100 | #206 | Poor 16.6% |
| New Zealanders | 13.7 /100 | #207 | Poor 16.6% |
| Eastern Europeans | 13.7 /100 | #208 | Poor 16.6% |
| Europeans | 13.2 /100 | #209 | Poor 16.6% |
| Guatemalans | 12.9 /100 | #210 | Poor 16.6% |
| Arabs | 12.8 /100 | #211 | Poor 16.6% |
| Immigrants | Southern Europe | 11.2 /100 | #212 | Poor 16.7% |
| Ghanaians | 11.0 /100 | #213 | Poor 16.7% |