Liberian vs Immigrants from Jordan Male Poverty
COMPARE
Liberian
Immigrants from Jordan
Male Poverty
Male Poverty Comparison
Liberians
Immigrants from Jordan
12.8%
MALE POVERTY
0.3/ 100
METRIC RATING
245th/ 347
METRIC RANK
10.8%
MALE POVERTY
77.5/ 100
METRIC RATING
139th/ 347
METRIC RANK
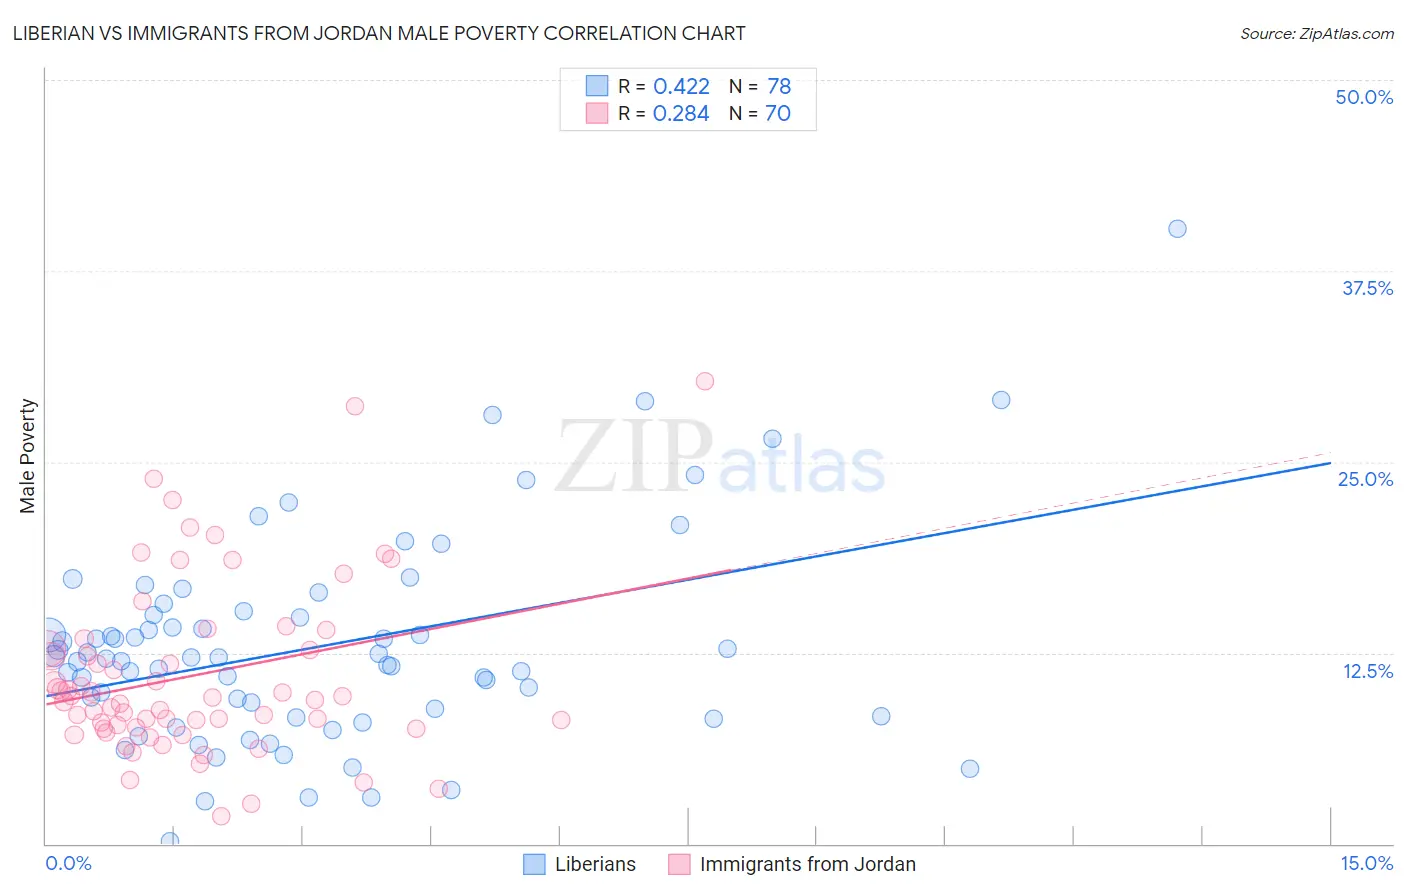
Liberian vs Immigrants from Jordan Male Poverty Correlation Chart
The statistical analysis conducted on geographies consisting of 118,033,924 people shows a moderate positive correlation between the proportion of Liberians and poverty level among males in the United States with a correlation coefficient (R) of 0.422 and weighted average of 12.8%. Similarly, the statistical analysis conducted on geographies consisting of 181,249,904 people shows a weak positive correlation between the proportion of Immigrants from Jordan and poverty level among males in the United States with a correlation coefficient (R) of 0.284 and weighted average of 10.8%, a difference of 18.0%.
Male Poverty Correlation Summary
| Measurement | Liberian | Immigrants from Jordan |
| Minimum | 0.17% | 1.8% |
| Maximum | 40.3% | 30.3% |
| Range | 40.1% | 28.5% |
| Mean | 12.9% | 11.0% |
| Median | 12.1% | 9.5% |
| Interquartile 25% (IQ1) | 8.4% | 7.6% |
| Interquartile 75% (IQ3) | 15.0% | 12.7% |
| Interquartile Range (IQR) | 6.6% | 5.2% |
| Standard Deviation (Sample) | 6.8% | 5.7% |
| Standard Deviation (Population) | 6.8% | 5.7% |
Similar Demographics by Male Poverty
Demographics Similar to Liberians by Male Poverty
In terms of male poverty, the demographic groups most similar to Liberians are Tsimshian (12.8%, a difference of 0.010%), Alaskan Athabascan (12.8%, a difference of 0.12%), Nepalese (12.8%, a difference of 0.16%), Immigrants from El Salvador (12.8%, a difference of 0.30%), and Sudanese (12.8%, a difference of 0.32%).
| Demographics | Rating | Rank | Male Poverty |
| Ecuadorians | 0.4 /100 | #238 | Tragic 12.7% |
| Ghanaians | 0.4 /100 | #239 | Tragic 12.7% |
| Immigrants | Middle Africa | 0.4 /100 | #240 | Tragic 12.7% |
| Sudanese | 0.3 /100 | #241 | Tragic 12.8% |
| Nepalese | 0.3 /100 | #242 | Tragic 12.8% |
| Alaskan Athabascans | 0.3 /100 | #243 | Tragic 12.8% |
| Tsimshian | 0.3 /100 | #244 | Tragic 12.8% |
| Liberians | 0.3 /100 | #245 | Tragic 12.8% |
| Immigrants | El Salvador | 0.2 /100 | #246 | Tragic 12.8% |
| Immigrants | Western Africa | 0.2 /100 | #247 | Tragic 12.9% |
| Immigrants | Sudan | 0.2 /100 | #248 | Tragic 12.9% |
| Potawatomi | 0.2 /100 | #249 | Tragic 12.9% |
| Immigrants | Nicaragua | 0.2 /100 | #250 | Tragic 12.9% |
| Immigrants | Cuba | 0.2 /100 | #251 | Tragic 12.9% |
| Immigrants | Ecuador | 0.2 /100 | #252 | Tragic 12.9% |
Demographics Similar to Immigrants from Jordan by Male Poverty
In terms of male poverty, the demographic groups most similar to Immigrants from Jordan are Yugoslavian (10.8%, a difference of 0.12%), Tlingit-Haida (10.9%, a difference of 0.19%), Immigrants from France (10.9%, a difference of 0.23%), Immigrants from Switzerland (10.8%, a difference of 0.27%), and Basque (10.9%, a difference of 0.40%).
| Demographics | Rating | Rank | Male Poverty |
| Immigrants | Vietnam | 83.0 /100 | #132 | Excellent 10.8% |
| Pakistanis | 83.0 /100 | #133 | Excellent 10.8% |
| New Zealanders | 82.9 /100 | #134 | Excellent 10.8% |
| Brazilians | 82.7 /100 | #135 | Excellent 10.8% |
| Immigrants | Israel | 80.9 /100 | #136 | Excellent 10.8% |
| Immigrants | Switzerland | 79.2 /100 | #137 | Good 10.8% |
| Yugoslavians | 78.2 /100 | #138 | Good 10.8% |
| Immigrants | Jordan | 77.5 /100 | #139 | Good 10.8% |
| Tlingit-Haida | 76.1 /100 | #140 | Good 10.9% |
| Immigrants | France | 75.8 /100 | #141 | Good 10.9% |
| Basques | 74.6 /100 | #142 | Good 10.9% |
| Afghans | 71.9 /100 | #143 | Good 10.9% |
| Samoans | 71.8 /100 | #144 | Good 10.9% |
| Immigrants | Germany | 71.6 /100 | #145 | Good 10.9% |
| Syrians | 71.4 /100 | #146 | Good 10.9% |