Liberian vs Immigrants from Hungary Child Poverty Among Boys Under 16
COMPARE
Liberian
Immigrants from Hungary
Child Poverty Among Boys Under 16
Child Poverty Among Boys Under 16 Comparison
Liberians
Immigrants from Hungary
19.3%
CHILD POVERTY AMONG BOYS UNDER 16
0.2/ 100
METRIC RATING
253rd/ 347
METRIC RANK
15.7%
CHILD POVERTY AMONG BOYS UNDER 16
84.1/ 100
METRIC RATING
142nd/ 347
METRIC RANK
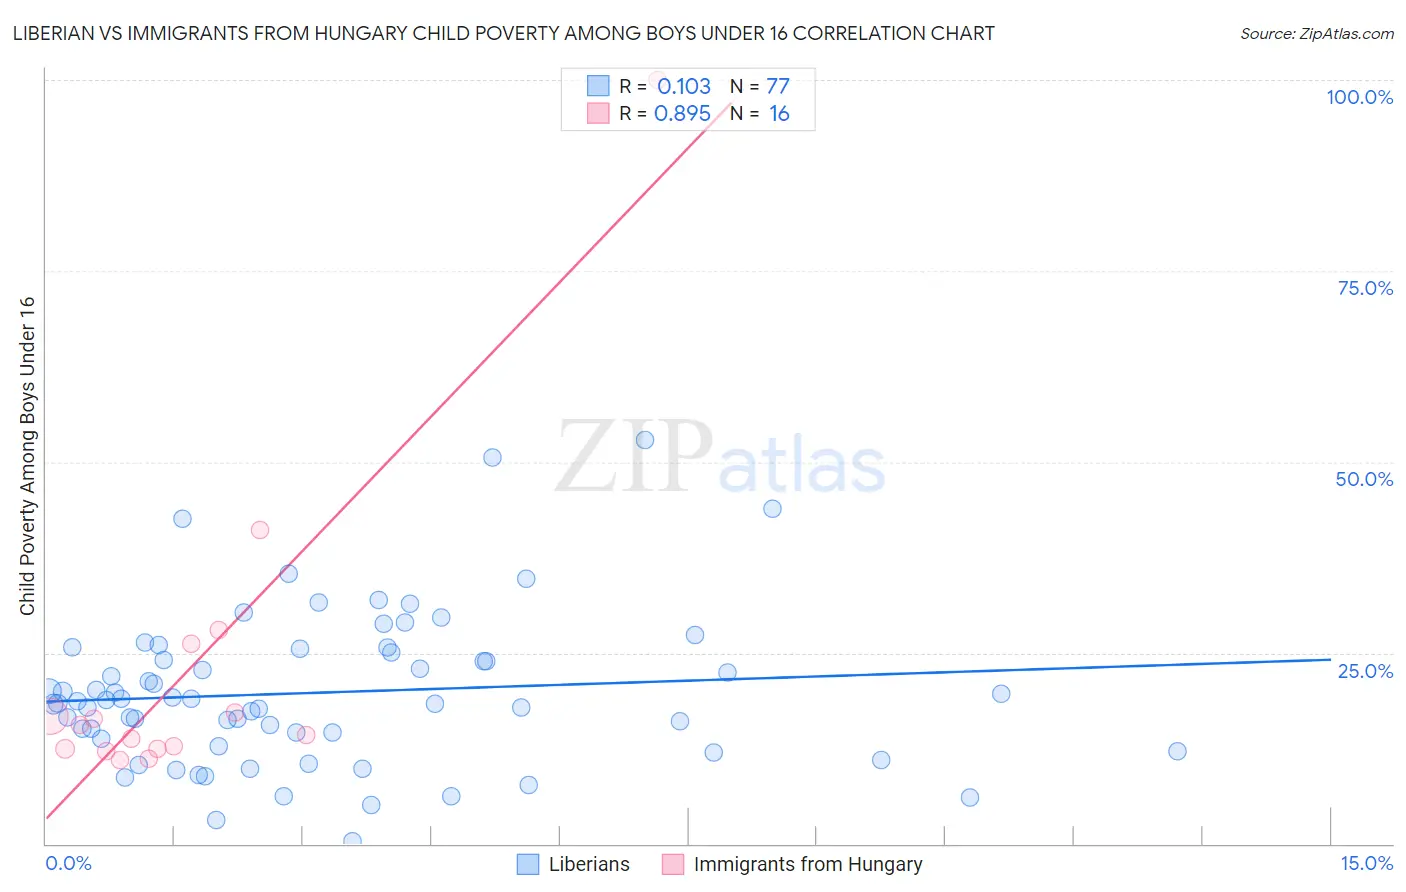
Liberian vs Immigrants from Hungary Child Poverty Among Boys Under 16 Correlation Chart
The statistical analysis conducted on geographies consisting of 117,632,985 people shows a poor positive correlation between the proportion of Liberians and poverty level among boys under the age of 16 in the United States with a correlation coefficient (R) of 0.103 and weighted average of 19.3%. Similarly, the statistical analysis conducted on geographies consisting of 193,561,492 people shows a very strong positive correlation between the proportion of Immigrants from Hungary and poverty level among boys under the age of 16 in the United States with a correlation coefficient (R) of 0.895 and weighted average of 15.7%, a difference of 23.0%.
Child Poverty Among Boys Under 16 Correlation Summary
| Measurement | Liberian | Immigrants from Hungary |
| Minimum | 0.35% | 10.9% |
| Maximum | 52.8% | 100.0% |
| Range | 52.5% | 89.1% |
| Mean | 19.8% | 22.5% |
| Median | 18.6% | 14.9% |
| Interquartile 25% (IQ1) | 13.2% | 12.4% |
| Interquartile 75% (IQ3) | 25.3% | 21.6% |
| Interquartile Range (IQR) | 12.0% | 9.2% |
| Standard Deviation (Sample) | 10.1% | 22.1% |
| Standard Deviation (Population) | 10.0% | 21.4% |
Similar Demographics by Child Poverty Among Boys Under 16
Demographics Similar to Liberians by Child Poverty Among Boys Under 16
In terms of child poverty among boys under 16, the demographic groups most similar to Liberians are Immigrants from Western Africa (19.3%, a difference of 0.070%), Trinidadian and Tobagonian (19.3%, a difference of 0.27%), Ecuadorian (19.3%, a difference of 0.27%), French American Indian (19.2%, a difference of 0.30%), and Immigrants from Liberia (19.3%, a difference of 0.30%).
| Demographics | Rating | Rank | Child Poverty Among Boys Under 16 |
| Immigrants | Nicaragua | 0.4 /100 | #246 | Tragic 19.0% |
| Immigrants | Trinidad and Tobago | 0.3 /100 | #247 | Tragic 19.0% |
| Salvadorans | 0.3 /100 | #248 | Tragic 19.0% |
| Alsatians | 0.3 /100 | #249 | Tragic 19.1% |
| Immigrants | Burma/Myanmar | 0.2 /100 | #250 | Tragic 19.2% |
| French American Indians | 0.2 /100 | #251 | Tragic 19.2% |
| Immigrants | Western Africa | 0.2 /100 | #252 | Tragic 19.3% |
| Liberians | 0.2 /100 | #253 | Tragic 19.3% |
| Trinidadians and Tobagonians | 0.2 /100 | #254 | Tragic 19.3% |
| Ecuadorians | 0.2 /100 | #255 | Tragic 19.3% |
| Immigrants | Liberia | 0.2 /100 | #256 | Tragic 19.3% |
| Mexican American Indians | 0.2 /100 | #257 | Tragic 19.4% |
| Potawatomi | 0.2 /100 | #258 | Tragic 19.4% |
| Spanish Americans | 0.2 /100 | #259 | Tragic 19.4% |
| Shoshone | 0.2 /100 | #260 | Tragic 19.4% |
Demographics Similar to Immigrants from Hungary by Child Poverty Among Boys Under 16
In terms of child poverty among boys under 16, the demographic groups most similar to Immigrants from Hungary are Slavic (15.7%, a difference of 0.090%), Immigrants from Fiji (15.7%, a difference of 0.11%), Immigrants from Peru (15.7%, a difference of 0.13%), Samoan (15.7%, a difference of 0.18%), and New Zealander (15.7%, a difference of 0.34%).
| Demographics | Rating | Rank | Child Poverty Among Boys Under 16 |
| Portuguese | 87.5 /100 | #135 | Excellent 15.5% |
| Icelanders | 87.5 /100 | #136 | Excellent 15.5% |
| Immigrants | Spain | 87.1 /100 | #137 | Excellent 15.6% |
| Immigrants | Southern Europe | 86.5 /100 | #138 | Excellent 15.6% |
| Albanians | 86.5 /100 | #139 | Excellent 15.6% |
| Immigrants | Kuwait | 85.6 /100 | #140 | Excellent 15.6% |
| Slavs | 84.5 /100 | #141 | Excellent 15.7% |
| Immigrants | Hungary | 84.1 /100 | #142 | Excellent 15.7% |
| Immigrants | Fiji | 83.6 /100 | #143 | Excellent 15.7% |
| Immigrants | Peru | 83.5 /100 | #144 | Excellent 15.7% |
| Samoans | 83.2 /100 | #145 | Excellent 15.7% |
| New Zealanders | 82.4 /100 | #146 | Excellent 15.7% |
| Venezuelans | 82.1 /100 | #147 | Excellent 15.7% |
| Brazilians | 81.0 /100 | #148 | Excellent 15.8% |
| Slovaks | 80.3 /100 | #149 | Excellent 15.8% |