Lebanese vs Swedish Family Poverty
COMPARE
Lebanese
Swedish
Family Poverty
Family Poverty Comparison
Lebanese
Swedes
8.9%
FAMILY POVERTY
57.6/ 100
METRIC RATING
171st/ 347
METRIC RANK
7.1%
FAMILY POVERTY
99.8/ 100
METRIC RATING
13th/ 347
METRIC RANK
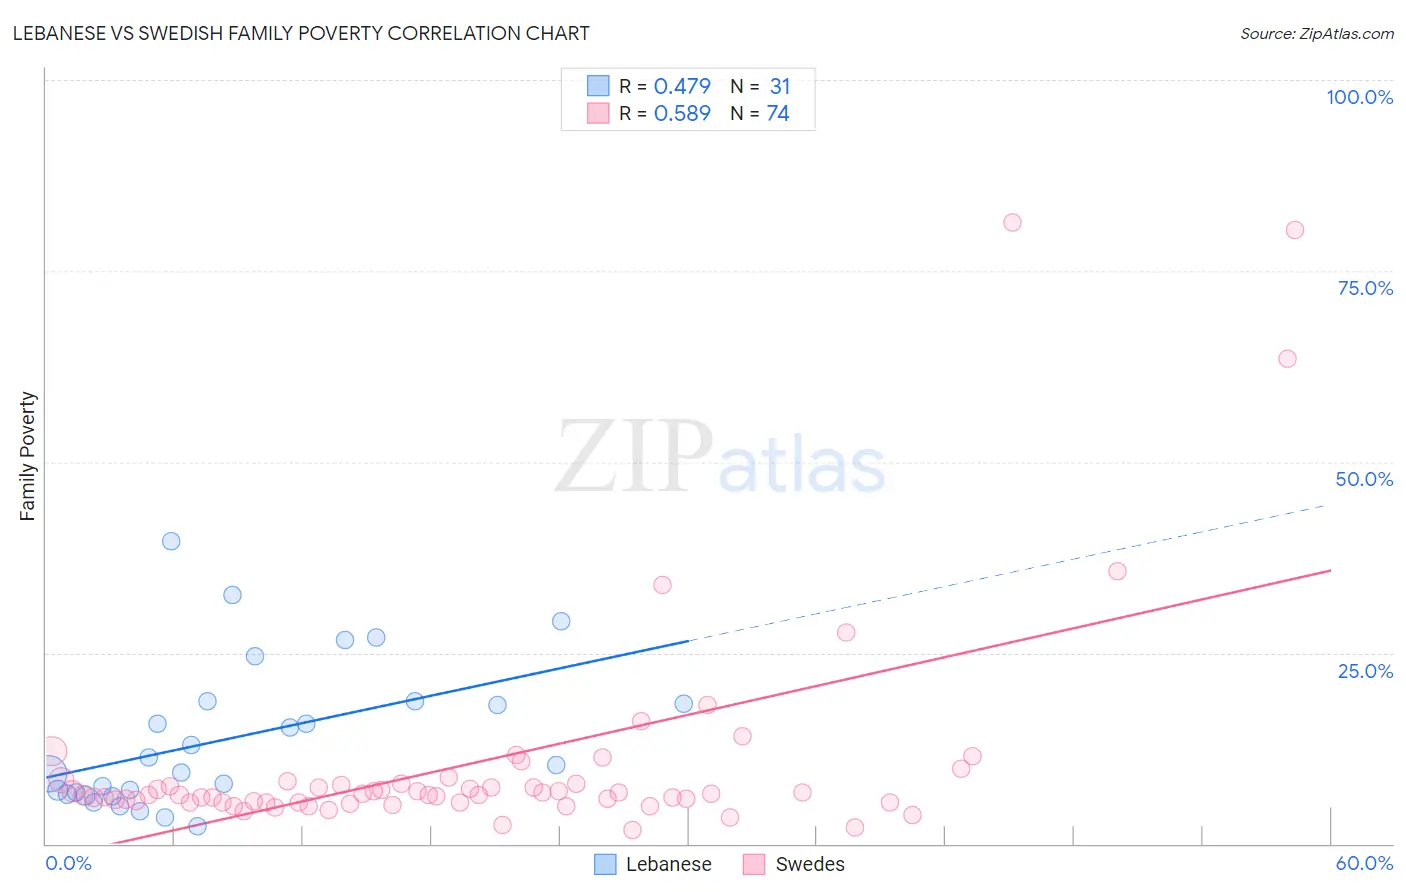
Lebanese vs Swedish Family Poverty Correlation Chart
The statistical analysis conducted on geographies consisting of 400,253,340 people shows a moderate positive correlation between the proportion of Lebanese and poverty level among families in the United States with a correlation coefficient (R) of 0.479 and weighted average of 8.9%. Similarly, the statistical analysis conducted on geographies consisting of 535,382,987 people shows a substantial positive correlation between the proportion of Swedes and poverty level among families in the United States with a correlation coefficient (R) of 0.589 and weighted average of 7.1%, a difference of 25.2%.
Family Poverty Correlation Summary
| Measurement | Lebanese | Swedish |
| Minimum | 2.3% | 1.8% |
| Maximum | 39.7% | 81.3% |
| Range | 37.3% | 79.6% |
| Mean | 13.8% | 10.7% |
| Median | 10.4% | 6.5% |
| Interquartile 25% (IQ1) | 6.5% | 5.4% |
| Interquartile 75% (IQ3) | 18.7% | 7.9% |
| Interquartile Range (IQR) | 12.2% | 2.5% |
| Standard Deviation (Sample) | 9.5% | 14.6% |
| Standard Deviation (Population) | 9.4% | 14.5% |
Similar Demographics by Family Poverty
Demographics Similar to Lebanese by Family Poverty
In terms of family poverty, the demographic groups most similar to Lebanese are Immigrants from Peru (8.9%, a difference of 0.010%), Kenyan (8.9%, a difference of 0.080%), Immigrants from Fiji (8.9%, a difference of 0.16%), Immigrants from Chile (8.9%, a difference of 0.27%), and Israeli (8.9%, a difference of 0.62%).
| Demographics | Rating | Rank | Family Poverty |
| Celtics | 64.9 /100 | #164 | Good 8.8% |
| Guamanians/Chamorros | 64.7 /100 | #165 | Good 8.8% |
| Afghans | 63.5 /100 | #166 | Good 8.8% |
| Immigrants | Ethiopia | 62.5 /100 | #167 | Good 8.9% |
| Israelis | 62.1 /100 | #168 | Good 8.9% |
| Immigrants | Chile | 59.6 /100 | #169 | Average 8.9% |
| Kenyans | 58.2 /100 | #170 | Average 8.9% |
| Lebanese | 57.6 /100 | #171 | Average 8.9% |
| Immigrants | Peru | 57.5 /100 | #172 | Average 8.9% |
| Immigrants | Fiji | 56.4 /100 | #173 | Average 8.9% |
| Immigrants | Albania | 50.0 /100 | #174 | Average 9.0% |
| Costa Ricans | 49.3 /100 | #175 | Average 9.0% |
| Immigrants | Syria | 47.5 /100 | #176 | Average 9.0% |
| Hawaiians | 47.2 /100 | #177 | Average 9.0% |
| Immigrants | Cameroon | 47.1 /100 | #178 | Average 9.0% |
Demographics Similar to Swedes by Family Poverty
In terms of family poverty, the demographic groups most similar to Swedes are Iranian (7.1%, a difference of 0.010%), Maltese (7.1%, a difference of 0.050%), Immigrants from Singapore (7.1%, a difference of 0.34%), Bulgarian (7.1%, a difference of 0.35%), and Latvian (7.1%, a difference of 0.60%).
| Demographics | Rating | Rank | Family Poverty |
| Norwegians | 99.9 /100 | #6 | Exceptional 6.9% |
| Immigrants | Ireland | 99.9 /100 | #7 | Exceptional 7.0% |
| Bhutanese | 99.9 /100 | #8 | Exceptional 7.0% |
| Latvians | 99.9 /100 | #9 | Exceptional 7.1% |
| Bulgarians | 99.8 /100 | #10 | Exceptional 7.1% |
| Immigrants | Singapore | 99.8 /100 | #11 | Exceptional 7.1% |
| Maltese | 99.8 /100 | #12 | Exceptional 7.1% |
| Swedes | 99.8 /100 | #13 | Exceptional 7.1% |
| Iranians | 99.8 /100 | #14 | Exceptional 7.1% |
| Lithuanians | 99.8 /100 | #15 | Exceptional 7.2% |
| Immigrants | South Central Asia | 99.8 /100 | #16 | Exceptional 7.2% |
| Luxembourgers | 99.8 /100 | #17 | Exceptional 7.2% |
| Immigrants | Lithuania | 99.8 /100 | #18 | Exceptional 7.2% |
| Eastern Europeans | 99.7 /100 | #19 | Exceptional 7.2% |
| Immigrants | Hong Kong | 99.7 /100 | #20 | Exceptional 7.3% |