Latvian vs Syrian Single Female Poverty
COMPARE
Latvian
Syrian
Single Female Poverty
Single Female Poverty Comparison
Latvians
Syrians
19.0%
SINGLE FEMALE POVERTY
99.8/ 100
METRIC RATING
47th/ 347
METRIC RANK
20.3%
SINGLE FEMALE POVERTY
90.4/ 100
METRIC RATING
140th/ 347
METRIC RANK
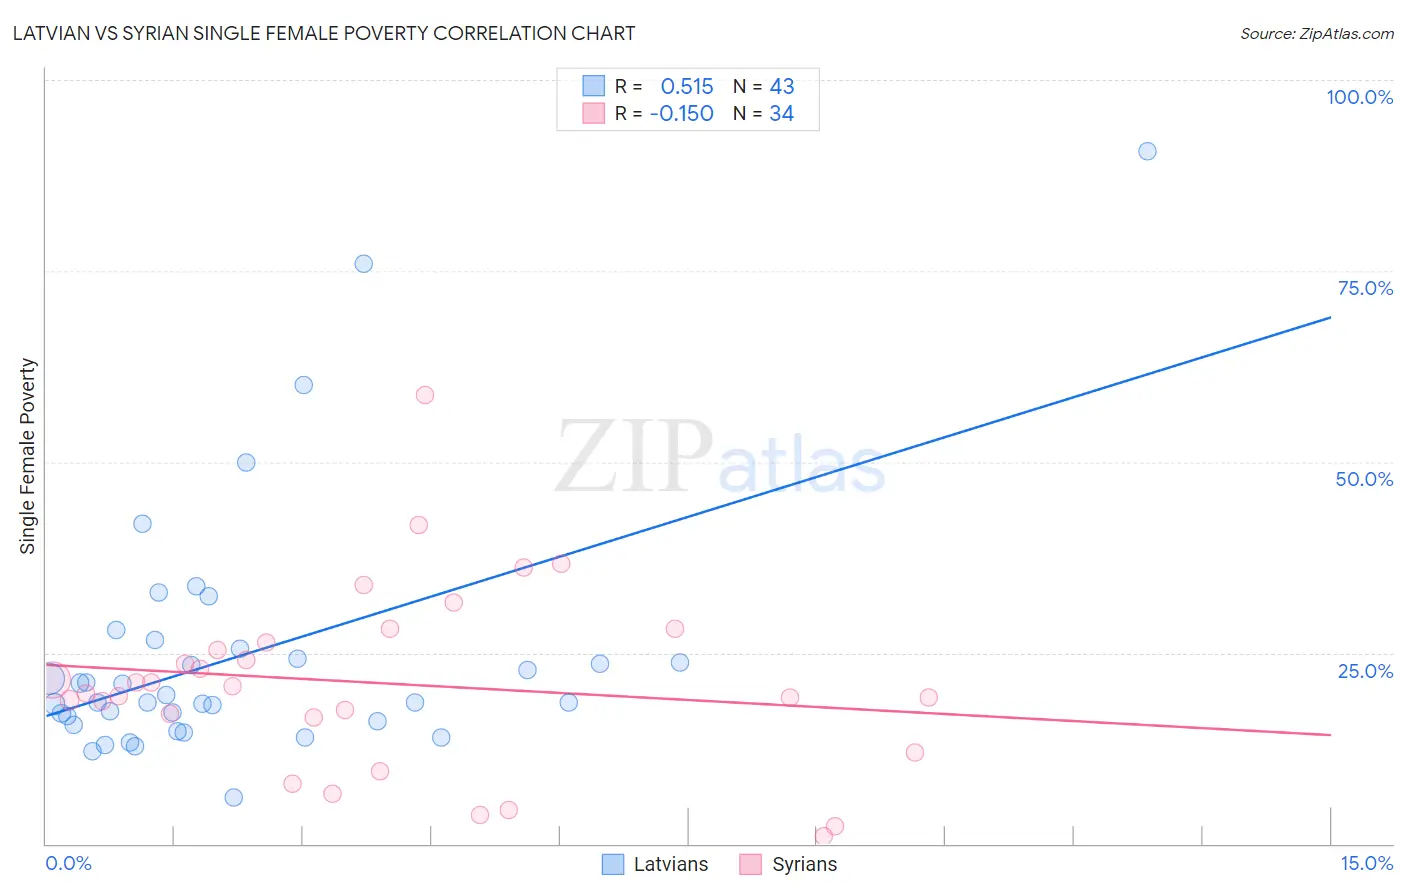
Latvian vs Syrian Single Female Poverty Correlation Chart
The statistical analysis conducted on geographies consisting of 217,777,893 people shows a substantial positive correlation between the proportion of Latvians and poverty level among single females in the United States with a correlation coefficient (R) of 0.515 and weighted average of 19.0%. Similarly, the statistical analysis conducted on geographies consisting of 263,006,420 people shows a poor negative correlation between the proportion of Syrians and poverty level among single females in the United States with a correlation coefficient (R) of -0.150 and weighted average of 20.3%, a difference of 6.8%.
Single Female Poverty Correlation Summary
| Measurement | Latvian | Syrian |
| Minimum | 6.0% | 0.97% |
| Maximum | 90.7% | 58.7% |
| Range | 84.7% | 57.7% |
| Mean | 24.7% | 21.0% |
| Median | 18.5% | 20.2% |
| Interquartile 25% (IQ1) | 16.0% | 16.6% |
| Interquartile 75% (IQ3) | 25.6% | 26.4% |
| Interquartile Range (IQR) | 9.5% | 9.8% |
| Standard Deviation (Sample) | 16.6% | 12.0% |
| Standard Deviation (Population) | 16.4% | 11.8% |
Similar Demographics by Single Female Poverty
Demographics Similar to Latvians by Single Female Poverty
In terms of single female poverty, the demographic groups most similar to Latvians are Macedonian (18.9%, a difference of 0.19%), Immigrants from Argentina (19.0%, a difference of 0.28%), Immigrants from Czechoslovakia (19.0%, a difference of 0.29%), Immigrants from Eastern Europe (19.0%, a difference of 0.33%), and Immigrants from Indonesia (18.9%, a difference of 0.35%).
| Demographics | Rating | Rank | Single Female Poverty |
| Okinawans | 99.9 /100 | #40 | Exceptional 18.8% |
| Immigrants | Serbia | 99.9 /100 | #41 | Exceptional 18.8% |
| Jordanians | 99.9 /100 | #42 | Exceptional 18.8% |
| Immigrants | Romania | 99.9 /100 | #43 | Exceptional 18.8% |
| Immigrants | Croatia | 99.9 /100 | #44 | Exceptional 18.9% |
| Immigrants | Indonesia | 99.8 /100 | #45 | Exceptional 18.9% |
| Macedonians | 99.8 /100 | #46 | Exceptional 18.9% |
| Latvians | 99.8 /100 | #47 | Exceptional 19.0% |
| Immigrants | Argentina | 99.8 /100 | #48 | Exceptional 19.0% |
| Immigrants | Czechoslovakia | 99.8 /100 | #49 | Exceptional 19.0% |
| Immigrants | Eastern Europe | 99.8 /100 | #50 | Exceptional 19.0% |
| Immigrants | Italy | 99.8 /100 | #51 | Exceptional 19.0% |
| Egyptians | 99.7 /100 | #52 | Exceptional 19.1% |
| Tsimshian | 99.7 /100 | #53 | Exceptional 19.1% |
| Argentineans | 99.7 /100 | #54 | Exceptional 19.1% |
Demographics Similar to Syrians by Single Female Poverty
In terms of single female poverty, the demographic groups most similar to Syrians are Slovene (20.3%, a difference of 0.010%), Immigrants from Kuwait (20.3%, a difference of 0.010%), Immigrants from Nepal (20.3%, a difference of 0.050%), Immigrants from North America (20.3%, a difference of 0.15%), and Immigrants from Iraq (20.2%, a difference of 0.16%).
| Demographics | Rating | Rank | Single Female Poverty |
| Immigrants | England | 91.9 /100 | #133 | Exceptional 20.2% |
| Immigrants | Venezuela | 91.5 /100 | #134 | Exceptional 20.2% |
| Immigrants | Iraq | 91.2 /100 | #135 | Exceptional 20.2% |
| Immigrants | Canada | 91.2 /100 | #136 | Exceptional 20.2% |
| Immigrants | Nepal | 90.6 /100 | #137 | Exceptional 20.3% |
| Slovenes | 90.5 /100 | #138 | Exceptional 20.3% |
| Immigrants | Kuwait | 90.4 /100 | #139 | Exceptional 20.3% |
| Syrians | 90.4 /100 | #140 | Exceptional 20.3% |
| Immigrants | North America | 89.5 /100 | #141 | Excellent 20.3% |
| Immigrants | Uganda | 89.1 /100 | #142 | Excellent 20.3% |
| Australians | 88.4 /100 | #143 | Excellent 20.3% |
| Immigrants | Uzbekistan | 88.3 /100 | #144 | Excellent 20.3% |
| Austrians | 85.8 /100 | #145 | Excellent 20.4% |
| Venezuelans | 85.5 /100 | #146 | Excellent 20.4% |
| South Africans | 85.3 /100 | #147 | Excellent 20.4% |