Latvian vs Immigrants from Canada Single Male Poverty
COMPARE
Latvian
Immigrants from Canada
Single Male Poverty
Single Male Poverty Comparison
Latvians
Immigrants from Canada
12.7%
SINGLE MALE POVERTY
67.9/ 100
METRIC RATING
157th/ 347
METRIC RANK
12.8%
SINGLE MALE POVERTY
44.8/ 100
METRIC RATING
177th/ 347
METRIC RANK
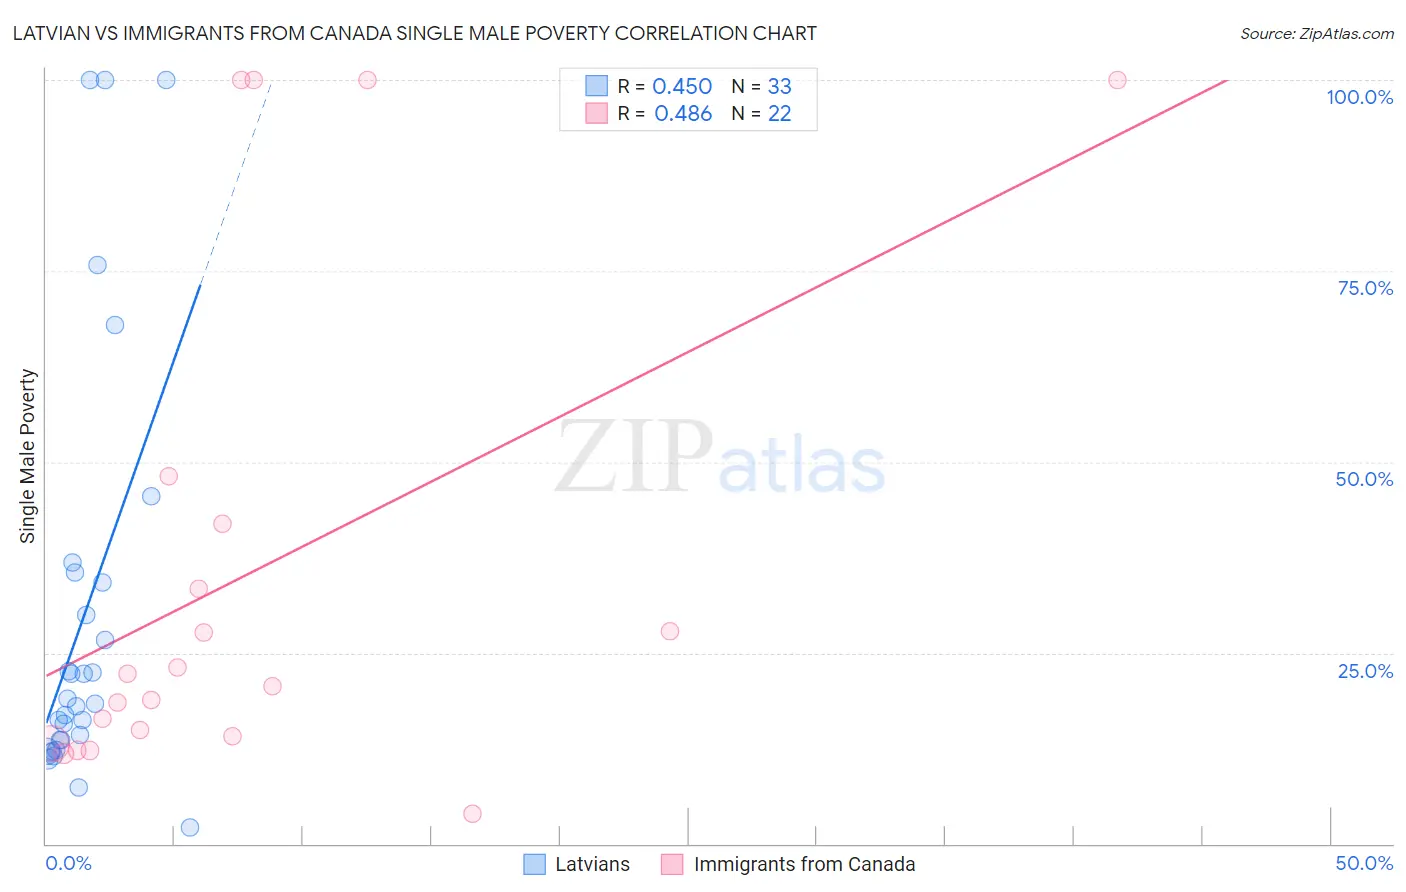
Latvian vs Immigrants from Canada Single Male Poverty Correlation Chart
The statistical analysis conducted on geographies consisting of 199,264,855 people shows a moderate positive correlation between the proportion of Latvians and poverty level among single males in the United States with a correlation coefficient (R) of 0.450 and weighted average of 12.7%. Similarly, the statistical analysis conducted on geographies consisting of 395,473,582 people shows a moderate positive correlation between the proportion of Immigrants from Canada and poverty level among single males in the United States with a correlation coefficient (R) of 0.486 and weighted average of 12.8%, a difference of 1.3%.
Single Male Poverty Correlation Summary
| Measurement | Latvian | Immigrants from Canada |
| Minimum | 2.2% | 4.0% |
| Maximum | 100.0% | 100.0% |
| Range | 97.8% | 96.0% |
| Mean | 29.8% | 35.5% |
| Median | 18.3% | 21.5% |
| Interquartile 25% (IQ1) | 13.0% | 14.1% |
| Interquartile 75% (IQ3) | 34.9% | 41.9% |
| Interquartile Range (IQR) | 21.9% | 27.8% |
| Standard Deviation (Sample) | 27.4% | 32.7% |
| Standard Deviation (Population) | 27.0% | 32.0% |
Demographics Similar to Latvians and Immigrants from Canada by Single Male Poverty
In terms of single male poverty, the demographic groups most similar to Latvians are Immigrants from Middle Africa (12.7%, a difference of 0.18%), Immigrants from Liberia (12.7%, a difference of 0.22%), Greek (12.7%, a difference of 0.23%), Immigrants from Africa (12.7%, a difference of 0.27%), and Eastern European (12.7%, a difference of 0.27%). Similarly, the demographic groups most similar to Immigrants from Canada are Syrian (12.8%, a difference of 0.19%), Croatian (12.8%, a difference of 0.22%), Costa Rican (12.8%, a difference of 0.28%), Immigrants from St. Vincent and the Grenadines (12.8%, a difference of 0.33%), and Danish (12.8%, a difference of 0.35%).
| Demographics | Rating | Rank | Single Male Poverty |
| Latvians | 67.9 /100 | #157 | Good 12.7% |
| Immigrants | Middle Africa | 64.9 /100 | #158 | Good 12.7% |
| Immigrants | Liberia | 64.2 /100 | #159 | Good 12.7% |
| Greeks | 64.1 /100 | #160 | Good 12.7% |
| Immigrants | Africa | 63.4 /100 | #161 | Good 12.7% |
| Eastern Europeans | 63.3 /100 | #162 | Good 12.7% |
| Palestinians | 63.1 /100 | #163 | Good 12.7% |
| Immigrants | Nigeria | 62.8 /100 | #164 | Good 12.7% |
| Immigrants | Cambodia | 62.2 /100 | #165 | Good 12.7% |
| Immigrants | Guyana | 60.5 /100 | #166 | Good 12.7% |
| Immigrants | Sudan | 58.2 /100 | #167 | Average 12.7% |
| Immigrants | Barbados | 57.7 /100 | #168 | Average 12.7% |
| Puget Sound Salish | 54.3 /100 | #169 | Average 12.8% |
| Guyanese | 52.0 /100 | #170 | Average 12.8% |
| South Africans | 51.5 /100 | #171 | Average 12.8% |
| Danes | 51.4 /100 | #172 | Average 12.8% |
| Immigrants | St. Vincent and the Grenadines | 50.9 /100 | #173 | Average 12.8% |
| Costa Ricans | 50.0 /100 | #174 | Average 12.8% |
| Croatians | 48.9 /100 | #175 | Average 12.8% |
| Syrians | 48.4 /100 | #176 | Average 12.8% |
| Immigrants | Canada | 44.8 /100 | #177 | Average 12.8% |