Laotian vs Russian Female Poverty Among 18-24 Year Olds
COMPARE
Laotian
Russian
Female Poverty Among 18-24 Year Olds
Female Poverty Among 18-24 Year Olds Comparison
Laotians
Russians
19.2%
FEMALE POVERTY AMONG 18-24 YEAR OLDS
97.1/ 100
METRIC RATING
110th/ 347
METRIC RANK
19.5%
FEMALE POVERTY AMONG 18-24 YEAR OLDS
91.5/ 100
METRIC RATING
136th/ 347
METRIC RANK
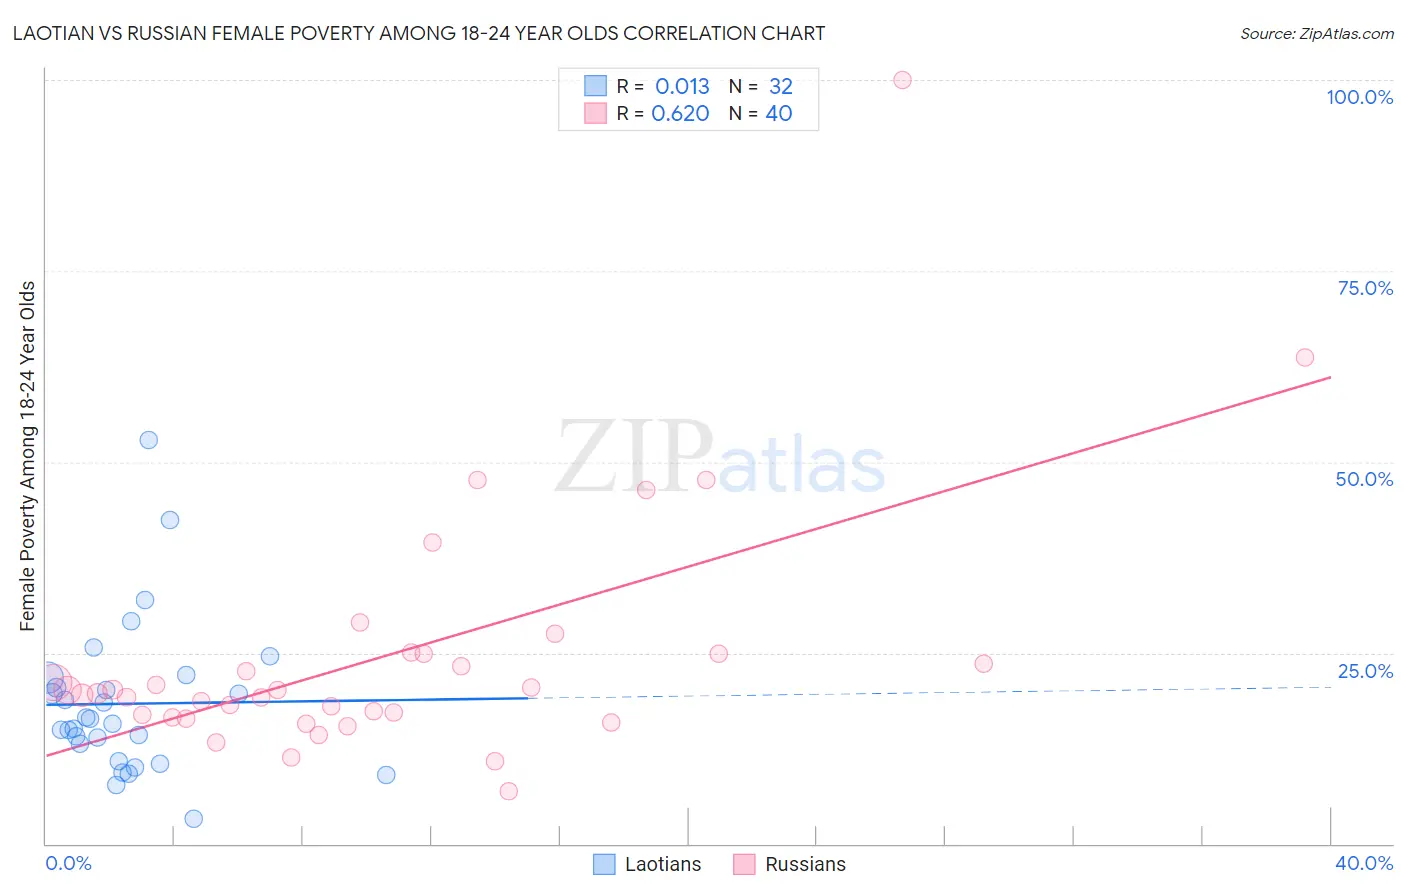
Laotian vs Russian Female Poverty Among 18-24 Year Olds Correlation Chart
The statistical analysis conducted on geographies consisting of 222,164,569 people shows no correlation between the proportion of Laotians and poverty level among females between the ages 18 and 24 in the United States with a correlation coefficient (R) of 0.013 and weighted average of 19.2%. Similarly, the statistical analysis conducted on geographies consisting of 488,100,625 people shows a significant positive correlation between the proportion of Russians and poverty level among females between the ages 18 and 24 in the United States with a correlation coefficient (R) of 0.620 and weighted average of 19.5%, a difference of 1.5%.
Female Poverty Among 18-24 Year Olds Correlation Summary
| Measurement | Laotian | Russian |
| Minimum | 3.3% | 6.9% |
| Maximum | 52.8% | 100.0% |
| Range | 49.5% | 93.1% |
| Mean | 18.3% | 24.7% |
| Median | 16.0% | 19.9% |
| Interquartile 25% (IQ1) | 12.0% | 16.7% |
| Interquartile 75% (IQ3) | 21.1% | 24.9% |
| Interquartile Range (IQR) | 9.1% | 8.2% |
| Standard Deviation (Sample) | 10.0% | 16.6% |
| Standard Deviation (Population) | 9.9% | 16.4% |
Similar Demographics by Female Poverty Among 18-24 Year Olds
Demographics Similar to Laotians by Female Poverty Among 18-24 Year Olds
In terms of female poverty among 18-24 year olds, the demographic groups most similar to Laotians are Immigrants from Serbia (19.2%, a difference of 0.020%), Immigrants from Syria (19.2%, a difference of 0.030%), Immigrants from Uzbekistan (19.2%, a difference of 0.11%), Immigrants from Sri Lanka (19.2%, a difference of 0.20%), and Immigrants from El Salvador (19.3%, a difference of 0.24%).
| Demographics | Rating | Rank | Female Poverty Among 18-24 Year Olds |
| Serbians | 98.0 /100 | #103 | Exceptional 19.1% |
| Immigrants | Afghanistan | 98.0 /100 | #104 | Exceptional 19.1% |
| Immigrants | Ecuador | 97.8 /100 | #105 | Exceptional 19.2% |
| Immigrants | Sierra Leone | 97.8 /100 | #106 | Exceptional 19.2% |
| Immigrants | Sri Lanka | 97.5 /100 | #107 | Exceptional 19.2% |
| Immigrants | Uzbekistan | 97.3 /100 | #108 | Exceptional 19.2% |
| Immigrants | Syria | 97.2 /100 | #109 | Exceptional 19.2% |
| Laotians | 97.1 /100 | #110 | Exceptional 19.2% |
| Immigrants | Serbia | 97.1 /100 | #111 | Exceptional 19.2% |
| Immigrants | El Salvador | 96.5 /100 | #112 | Exceptional 19.3% |
| Immigrants | Cameroon | 96.3 /100 | #113 | Exceptional 19.3% |
| Slovenes | 96.2 /100 | #114 | Exceptional 19.3% |
| Immigrants | Hungary | 96.2 /100 | #115 | Exceptional 19.3% |
| Immigrants | Immigrants | 95.9 /100 | #116 | Exceptional 19.3% |
| Immigrants | Iran | 95.8 /100 | #117 | Exceptional 19.3% |
Demographics Similar to Russians by Female Poverty Among 18-24 Year Olds
In terms of female poverty among 18-24 year olds, the demographic groups most similar to Russians are Soviet Union (19.5%, a difference of 0.090%), Jamaican (19.5%, a difference of 0.11%), Turkish (19.5%, a difference of 0.11%), Immigrants from North America (19.5%, a difference of 0.11%), and Austrian (19.5%, a difference of 0.12%).
| Demographics | Rating | Rank | Female Poverty Among 18-24 Year Olds |
| Immigrants | England | 92.9 /100 | #129 | Exceptional 19.5% |
| Immigrants | Canada | 92.9 /100 | #130 | Exceptional 19.5% |
| Latvians | 92.7 /100 | #131 | Exceptional 19.5% |
| Jamaicans | 92.1 /100 | #132 | Exceptional 19.5% |
| Turks | 92.1 /100 | #133 | Exceptional 19.5% |
| Immigrants | North America | 92.1 /100 | #134 | Exceptional 19.5% |
| Soviet Union | 92.0 /100 | #135 | Exceptional 19.5% |
| Russians | 91.5 /100 | #136 | Exceptional 19.5% |
| Austrians | 90.7 /100 | #137 | Exceptional 19.5% |
| Immigrants | Morocco | 89.9 /100 | #138 | Excellent 19.6% |
| Indians (Asian) | 88.3 /100 | #139 | Excellent 19.6% |
| Immigrants | Trinidad and Tobago | 85.6 /100 | #140 | Excellent 19.7% |
| Pennsylvania Germans | 85.5 /100 | #141 | Excellent 19.7% |
| Panamanians | 84.6 /100 | #142 | Excellent 19.7% |
| Slavs | 84.4 /100 | #143 | Excellent 19.7% |