Laotian vs Immigrants from Yemen Single Male Poverty
COMPARE
Laotian
Immigrants from Yemen
Single Male Poverty
Single Male Poverty Comparison
Laotians
Immigrants from Yemen
11.9%
SINGLE MALE POVERTY
99.6/ 100
METRIC RATING
65th/ 347
METRIC RANK
16.9%
SINGLE MALE POVERTY
0.0/ 100
METRIC RATING
324th/ 347
METRIC RANK
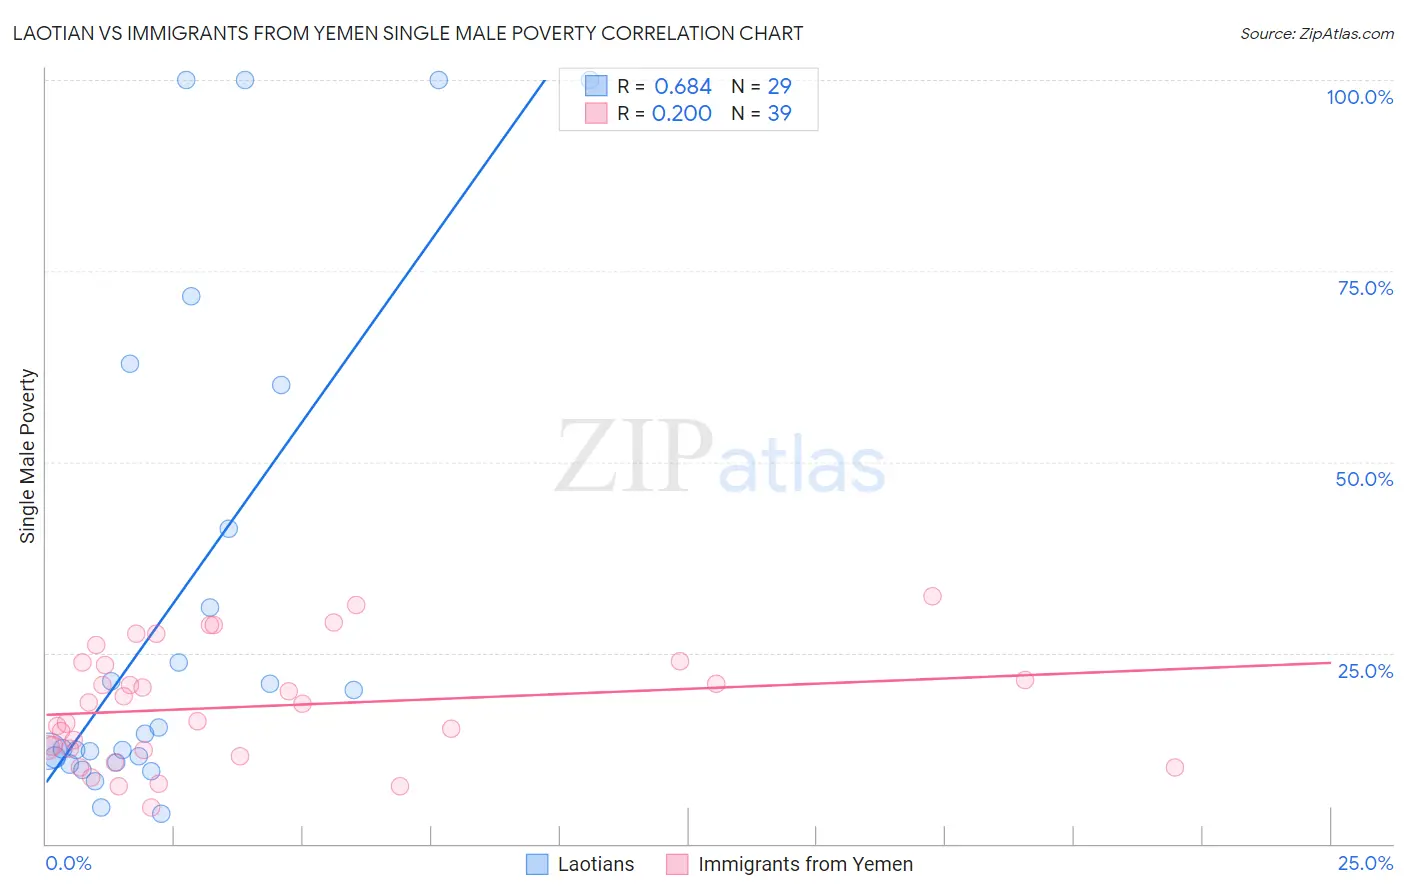
Laotian vs Immigrants from Yemen Single Male Poverty Correlation Chart
The statistical analysis conducted on geographies consisting of 207,953,623 people shows a significant positive correlation between the proportion of Laotians and poverty level among single males in the United States with a correlation coefficient (R) of 0.684 and weighted average of 11.9%. Similarly, the statistical analysis conducted on geographies consisting of 80,158,341 people shows a poor positive correlation between the proportion of Immigrants from Yemen and poverty level among single males in the United States with a correlation coefficient (R) of 0.200 and weighted average of 16.9%, a difference of 42.2%.
Single Male Poverty Correlation Summary
| Measurement | Laotian | Immigrants from Yemen |
| Minimum | 3.9% | 4.7% |
| Maximum | 100.0% | 32.4% |
| Range | 96.1% | 27.7% |
| Mean | 31.9% | 18.0% |
| Median | 14.3% | 18.3% |
| Interquartile 25% (IQ1) | 11.0% | 12.3% |
| Interquartile 75% (IQ3) | 50.7% | 23.7% |
| Interquartile Range (IQR) | 39.7% | 11.4% |
| Standard Deviation (Sample) | 32.6% | 7.4% |
| Standard Deviation (Population) | 32.0% | 7.3% |
Similar Demographics by Single Male Poverty
Demographics Similar to Laotians by Single Male Poverty
In terms of single male poverty, the demographic groups most similar to Laotians are Immigrants from Uruguay (11.9%, a difference of 0.0%), Immigrants from Ukraine (11.9%, a difference of 0.020%), Immigrants from Croatia (11.9%, a difference of 0.030%), Immigrants from Russia (11.9%, a difference of 0.060%), and Immigrants from Nepal (11.9%, a difference of 0.080%).
| Demographics | Rating | Rank | Single Male Poverty |
| Immigrants | Brazil | 99.8 /100 | #58 | Exceptional 11.7% |
| Brazilians | 99.8 /100 | #59 | Exceptional 11.8% |
| Peruvians | 99.8 /100 | #60 | Exceptional 11.8% |
| Cambodians | 99.8 /100 | #61 | Exceptional 11.8% |
| Immigrants | Sri Lanka | 99.7 /100 | #62 | Exceptional 11.8% |
| Immigrants | Belarus | 99.7 /100 | #63 | Exceptional 11.8% |
| Immigrants | Eastern Europe | 99.6 /100 | #64 | Exceptional 11.8% |
| Laotians | 99.6 /100 | #65 | Exceptional 11.9% |
| Immigrants | Uruguay | 99.6 /100 | #66 | Exceptional 11.9% |
| Immigrants | Ukraine | 99.6 /100 | #67 | Exceptional 11.9% |
| Immigrants | Croatia | 99.6 /100 | #68 | Exceptional 11.9% |
| Immigrants | Russia | 99.6 /100 | #69 | Exceptional 11.9% |
| Immigrants | Nepal | 99.6 /100 | #70 | Exceptional 11.9% |
| Immigrants | Greece | 99.6 /100 | #71 | Exceptional 11.9% |
| Immigrants | Argentina | 99.5 /100 | #72 | Exceptional 11.9% |
Demographics Similar to Immigrants from Yemen by Single Male Poverty
In terms of single male poverty, the demographic groups most similar to Immigrants from Yemen are Creek (16.8%, a difference of 0.11%), Choctaw (17.0%, a difference of 0.72%), Shoshone (16.7%, a difference of 1.1%), Central American Indian (17.2%, a difference of 2.3%), and Osage (16.5%, a difference of 2.4%).
| Demographics | Rating | Rank | Single Male Poverty |
| Blacks/African Americans | 0.0 /100 | #317 | Tragic 16.2% |
| Chickasaw | 0.0 /100 | #318 | Tragic 16.3% |
| Chippewa | 0.0 /100 | #319 | Tragic 16.4% |
| Marshallese | 0.0 /100 | #320 | Tragic 16.4% |
| Osage | 0.0 /100 | #321 | Tragic 16.5% |
| Shoshone | 0.0 /100 | #322 | Tragic 16.7% |
| Creek | 0.0 /100 | #323 | Tragic 16.8% |
| Immigrants | Yemen | 0.0 /100 | #324 | Tragic 16.9% |
| Choctaw | 0.0 /100 | #325 | Tragic 17.0% |
| Central American Indians | 0.0 /100 | #326 | Tragic 17.2% |
| Menominee | 0.0 /100 | #327 | Tragic 17.7% |
| Kiowa | 0.0 /100 | #328 | Tragic 18.3% |
| Colville | 0.0 /100 | #329 | Tragic 18.4% |
| Cajuns | 0.0 /100 | #330 | Tragic 19.1% |
| Paiute | 0.0 /100 | #331 | Tragic 19.3% |