Laotian vs Immigrants from Northern Africa Single Father Poverty
COMPARE
Laotian
Immigrants from Northern Africa
Single Father Poverty
Single Father Poverty Comparison
Laotians
Immigrants from Northern Africa
15.1%
SINGLE FATHER POVERTY
99.9/ 100
METRIC RATING
57th/ 347
METRIC RANK
15.3%
SINGLE FATHER POVERTY
99.5/ 100
METRIC RATING
79th/ 347
METRIC RANK
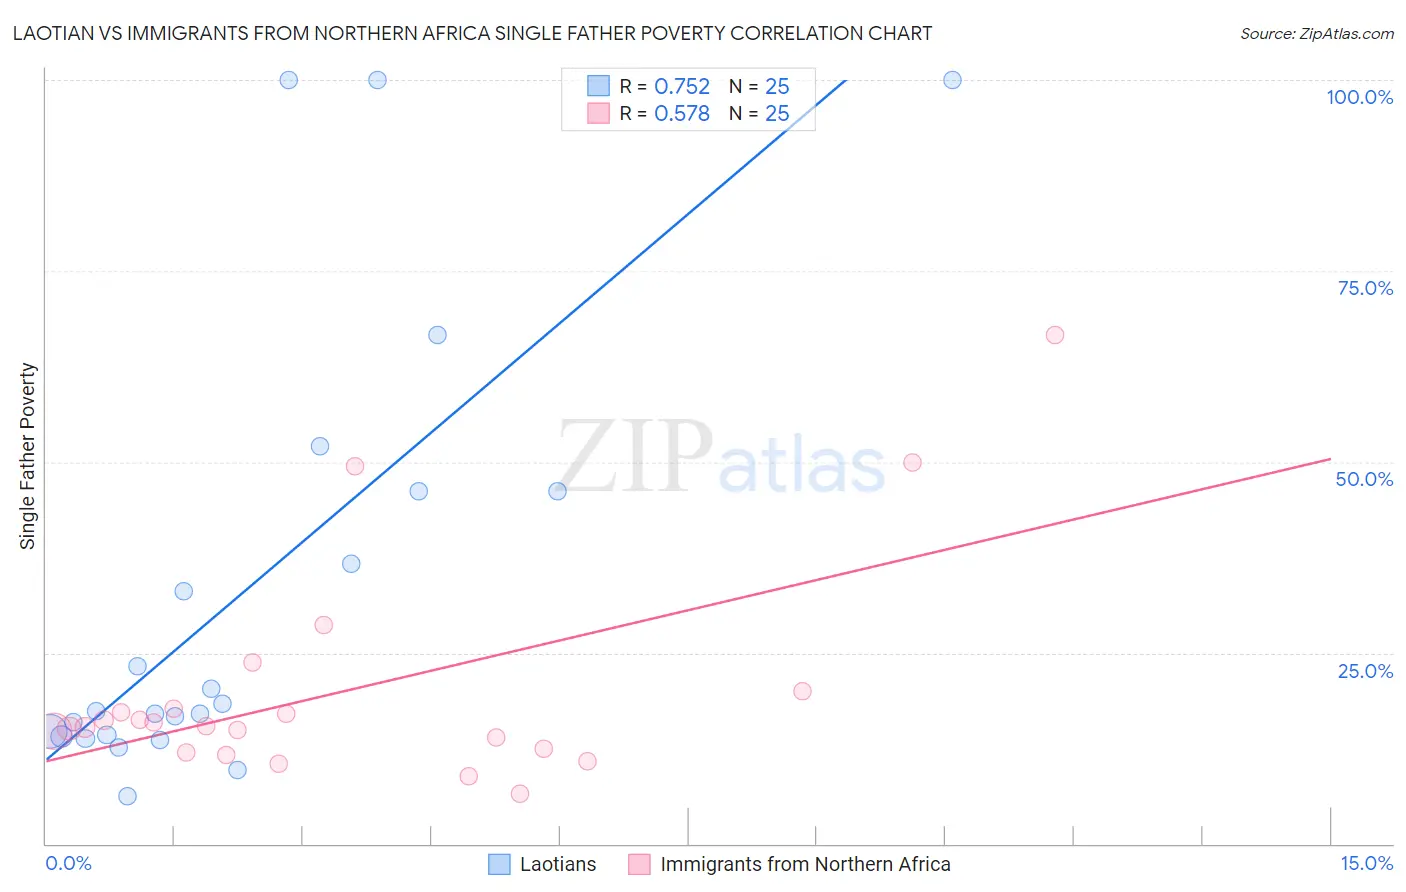
Laotian vs Immigrants from Northern Africa Single Father Poverty Correlation Chart
The statistical analysis conducted on geographies consisting of 189,346,173 people shows a strong positive correlation between the proportion of Laotians and poverty level among single fathers in the United States with a correlation coefficient (R) of 0.752 and weighted average of 15.1%. Similarly, the statistical analysis conducted on geographies consisting of 259,386,698 people shows a substantial positive correlation between the proportion of Immigrants from Northern Africa and poverty level among single fathers in the United States with a correlation coefficient (R) of 0.578 and weighted average of 15.3%, a difference of 1.8%.
Single Father Poverty Correlation Summary
| Measurement | Laotian | Immigrants from Northern Africa |
| Minimum | 6.3% | 6.6% |
| Maximum | 100.0% | 66.7% |
| Range | 93.7% | 60.1% |
| Mean | 33.0% | 20.0% |
| Median | 17.4% | 15.3% |
| Interquartile 25% (IQ1) | 14.1% | 12.2% |
| Interquartile 75% (IQ3) | 46.1% | 18.8% |
| Interquartile Range (IQR) | 32.0% | 6.7% |
| Standard Deviation (Sample) | 29.3% | 14.3% |
| Standard Deviation (Population) | 28.7% | 14.0% |
Similar Demographics by Single Father Poverty
Demographics Similar to Laotians by Single Father Poverty
In terms of single father poverty, the demographic groups most similar to Laotians are Hawaiian (15.1%, a difference of 0.060%), Immigrants from Laos (15.1%, a difference of 0.090%), Guamanian/Chamorro (15.1%, a difference of 0.15%), Immigrants from Bulgaria (15.0%, a difference of 0.36%), and Immigrants from Uzbekistan (15.0%, a difference of 0.41%).
| Demographics | Rating | Rank | Single Father Poverty |
| Bhutanese | 99.9 /100 | #50 | Exceptional 15.0% |
| Immigrants | Pakistan | 99.9 /100 | #51 | Exceptional 15.0% |
| Immigrants | El Salvador | 99.9 /100 | #52 | Exceptional 15.0% |
| Immigrants | Kenya | 99.9 /100 | #53 | Exceptional 15.0% |
| Immigrants | Uzbekistan | 99.9 /100 | #54 | Exceptional 15.0% |
| Immigrants | Bulgaria | 99.9 /100 | #55 | Exceptional 15.0% |
| Immigrants | Laos | 99.9 /100 | #56 | Exceptional 15.1% |
| Laotians | 99.9 /100 | #57 | Exceptional 15.1% |
| Hawaiians | 99.9 /100 | #58 | Exceptional 15.1% |
| Guamanians/Chamorros | 99.9 /100 | #59 | Exceptional 15.1% |
| Puget Sound Salish | 99.8 /100 | #60 | Exceptional 15.2% |
| Immigrants | Bosnia and Herzegovina | 99.8 /100 | #61 | Exceptional 15.2% |
| Immigrants | Armenia | 99.8 /100 | #62 | Exceptional 15.2% |
| Immigrants | Sweden | 99.8 /100 | #63 | Exceptional 15.2% |
| Bangladeshis | 99.8 /100 | #64 | Exceptional 15.2% |
Demographics Similar to Immigrants from Northern Africa by Single Father Poverty
In terms of single father poverty, the demographic groups most similar to Immigrants from Northern Africa are Tlingit-Haida (15.3%, a difference of 0.020%), Immigrants from Peru (15.3%, a difference of 0.060%), Immigrants from Japan (15.3%, a difference of 0.080%), Immigrants from Turkey (15.3%, a difference of 0.16%), and Maltese (15.3%, a difference of 0.17%).
| Demographics | Rating | Rank | Single Father Poverty |
| Immigrants | Lithuania | 99.6 /100 | #72 | Exceptional 15.3% |
| Kenyans | 99.6 /100 | #73 | Exceptional 15.3% |
| Maltese | 99.6 /100 | #74 | Exceptional 15.3% |
| Immigrants | Turkey | 99.5 /100 | #75 | Exceptional 15.3% |
| Immigrants | Japan | 99.5 /100 | #76 | Exceptional 15.3% |
| Immigrants | Peru | 99.5 /100 | #77 | Exceptional 15.3% |
| Tlingit-Haida | 99.5 /100 | #78 | Exceptional 15.3% |
| Immigrants | Northern Africa | 99.5 /100 | #79 | Exceptional 15.3% |
| Armenians | 99.4 /100 | #80 | Exceptional 15.4% |
| Immigrants | Congo | 99.4 /100 | #81 | Exceptional 15.4% |
| Immigrants | Ukraine | 99.4 /100 | #82 | Exceptional 15.4% |
| Chinese | 99.3 /100 | #83 | Exceptional 15.4% |
| Peruvians | 99.2 /100 | #84 | Exceptional 15.4% |
| Immigrants | Oceania | 99.1 /100 | #85 | Exceptional 15.4% |
| Immigrants | Russia | 99.0 /100 | #86 | Exceptional 15.5% |